Our work shows that falling back under the downtrending Gann angle at $61.13 will indicate the buying is getting weaker, while breaking below the uptrending Gann angle at $61.00 will signal the selling is getting stronger.
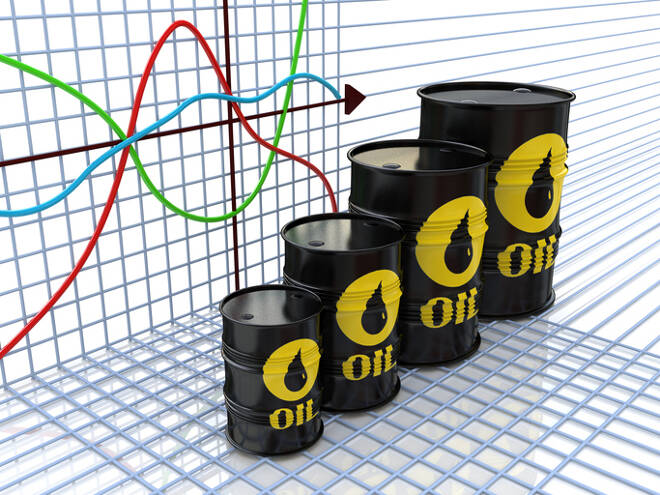
U.S. West Texas Intermediate crude oil futures finished slightly higher on Friday after clawing back from early session weakness. The market was pressured early on reports OPEC and its allies may decide to end the newly agreed upon deeper production cuts when they expire in March.
The market began to turnaround shortly before the mid-session after government data showed U.S. crude inventories fell far more than expected during the week-ended December 20. Upbeat data from China regarding profits at industrial firms was also supportive as well as expectations of increased demand growth.
On Friday, February WTI crude oil settled at $61.72, up $0.04 or +0.06%.
The main trend is up according to the daily swing chart. The uptrend was reaffirmed on Friday when buyers took out the previous session’s high. The market avoided a potentially bearish closing price reversal top when it clawed back earlier losses to finish marginally higher.
The nearest main bottom is $54.75, which means the uptrend is safe. However, the prolonged move up in terms of price and time makes the market vulnerable to a closing price reversal top.
If formed and confirmed, this chart pattern won’t indicate the trend is changing to down. However, it will indicate the selling is greater than the buying at current price levels. This could trigger the start of a 2 to 3 day correction.
The main range is $63.87 to $50.24. Its retracement zone at $58.66 to $57.06 is major support. Holding above this zone is also helping to generate the strong upside bias.
February WTI crude oil found support slightly above a Gann angle support cluster at $61.13 to $61.00. The angle at $61.13 was a former resistance angle. The angle at $61.00 has been guiding the market higher since the main bottom at $54.75 on November 20.
Our work shows that falling back under the downtrending Gann angle at $61.13 will indicate the buying is getting weaker, while breaking below the uptrending Gann angle at $61.00 will signal the selling is getting stronger.
If the upside momentum continues then we could see a test of the downtrending Gann angle at $62.47. This is the last potential resistance angle before the April 22 main top at $63.87.
If momentum shifts to the downside and the selling pressure increases then start preparing for an acceleration to the downside with $58.66 a possible downside target.
James Hyerczyk is a U.S. based seasoned technical analyst and educator with over 40 years of experience in market analysis and trading, specializing in chart patterns and price movement. He is the author of two books on technical analysis and has a background in both futures and stock markets.