



U.S. West Texas Intermediate crude oil futures are trading lower but inside yesterday’s range. This typically indicates investor indecision and impending volatility. The price action suggests the sanctions against Iran and the subsequent exemptions have been priced into the market. However, the new concern is lower demand. Today’s U.S. mid-term election results could affect demand because the outcomes are likely to influence the direction of the U.S. Dollar. A bullish dollar will weigh on foreign demand for dollar-denominated crude oil.
At 1244 GMT, December WTI crude oil is trading $62.81, down $0.29 or -0.45%.
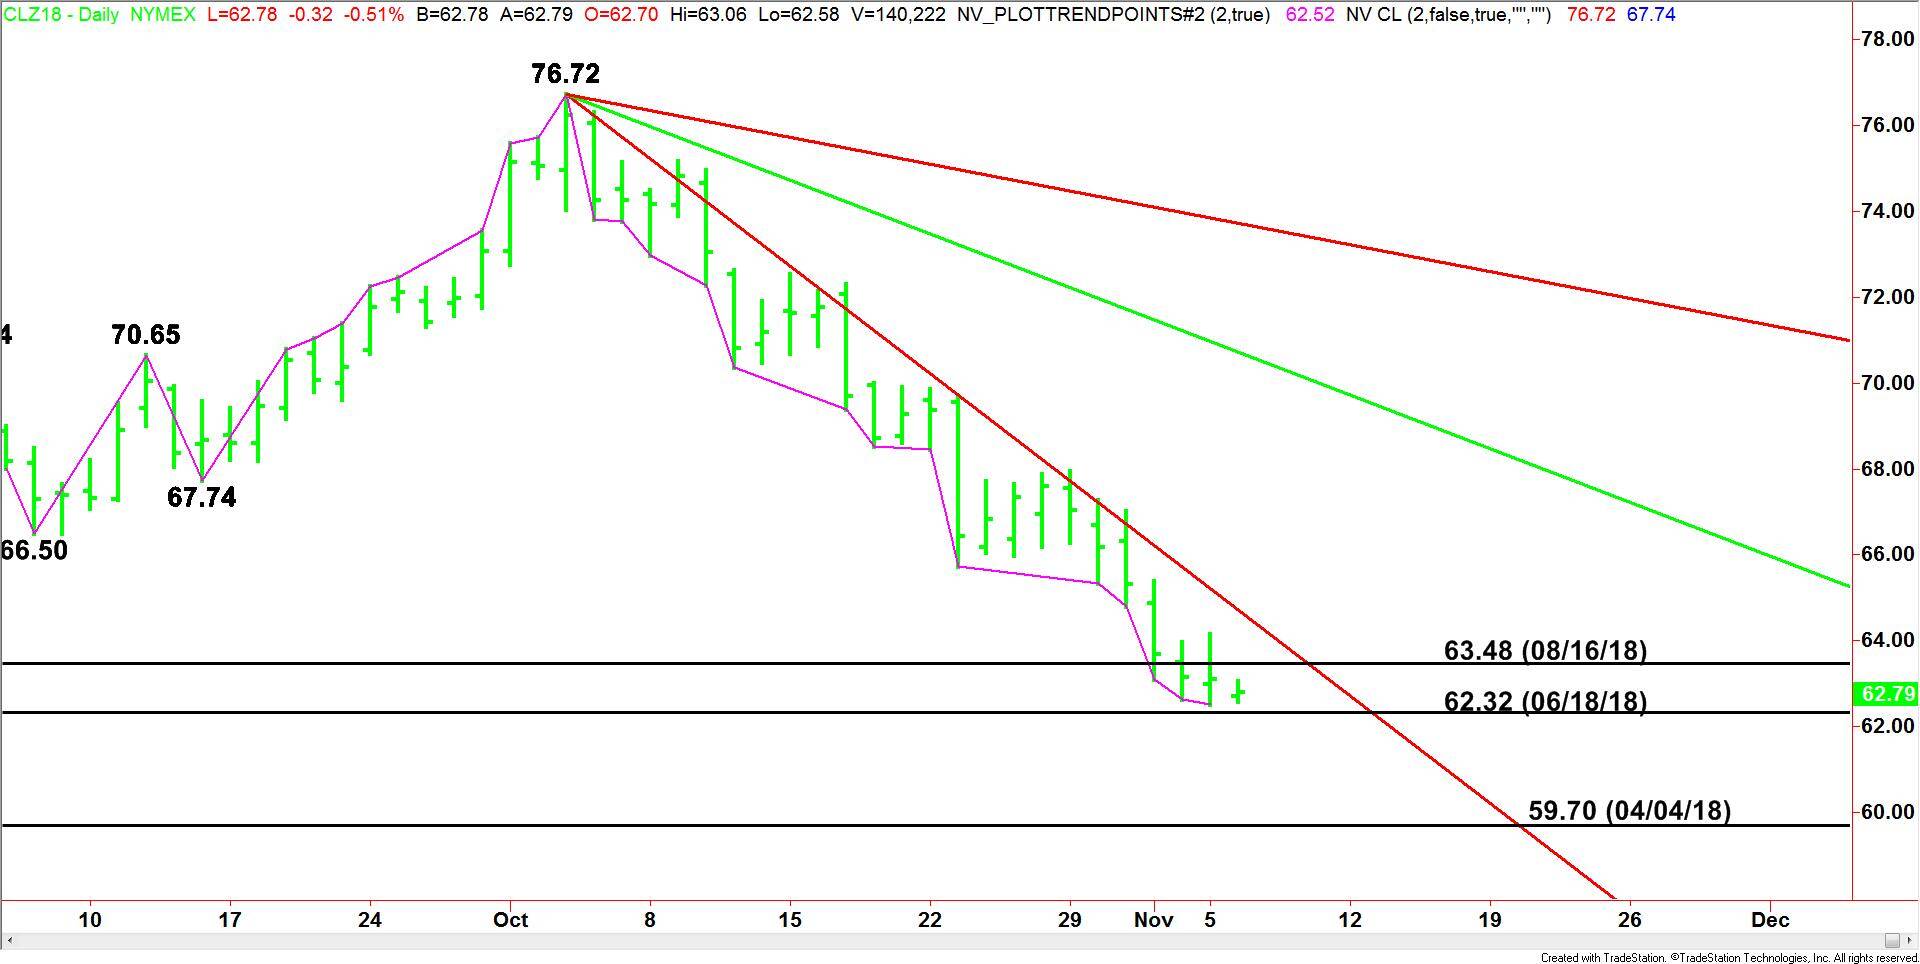
Daily Technical Analysis
The main trend is down according to the daily swing chart. A trade through yesterday’s low at $62.52 will signal a resumption of the downtrend. The market is in no position to change the trend to up, but it is in the window of time for a closing price reversal bottom. This chart pattern will signal that the buying is greater than the selling at current price levels and it could lead to a 2 to 3 day counter-trend rally.
The market is currently trading between a pair of main bottoms at $63.48 and $62.32. Trader reaction to these two levels could dictate the next move. If $62.32 fails as support, for example, we could see another acceleration to the downside with the April 4 bottom at $59.70 the next target.
Daily Technical Forecast
Based on the early price action, the direction of the December WTI crude oil futures contract on Tuesday is likely to be determined by trader reaction to the former bottoms at $63.48 and $62.32.
A sustained move over $63.48 will indicate the presence of buyers. If this move gains traction then look for a possible rally into a downtrending Gann angle at $64.72. This angle, moving down at a rate of .50 per day, has been guiding the market lower since October 3. Since the main trend is down, sellers are likely to come in on a test of this angle.
A sustained move under $62.32 will signal that the selling pressure is increasing. This could lead to another steep sell-off with $59.70 the next target.