


COIN Technical Analysis
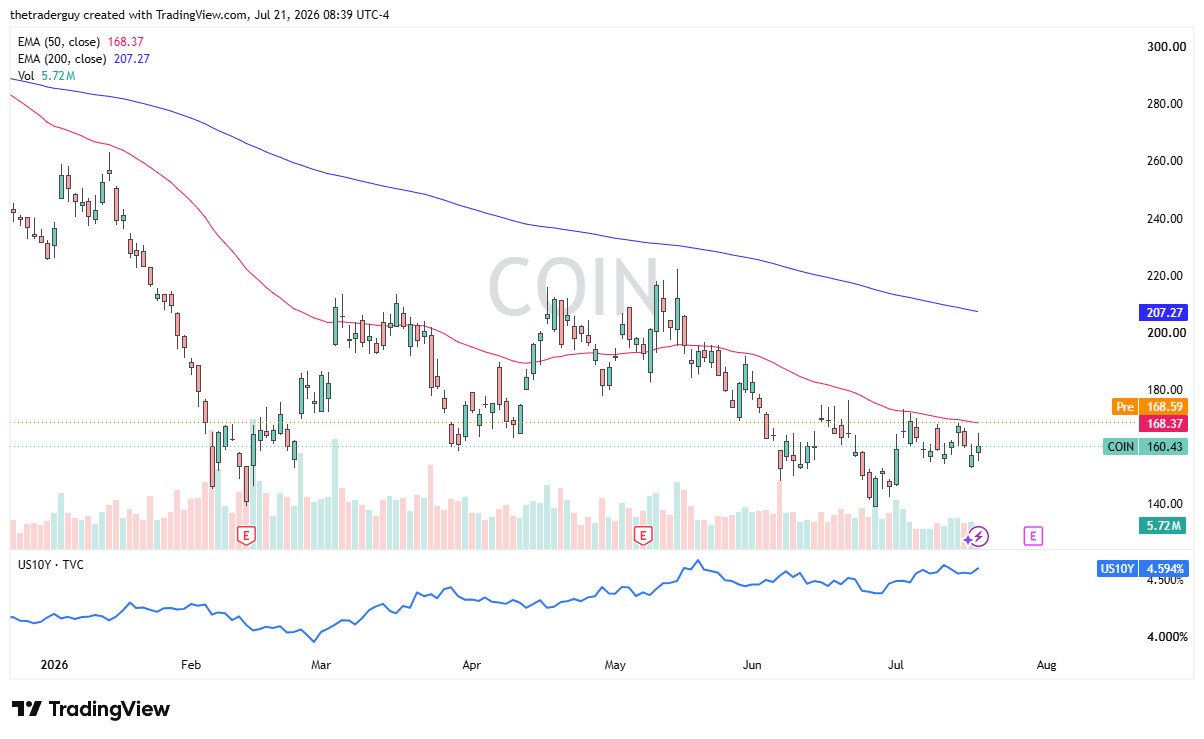
The pre-market trading for Coinbase is positive after Coinbase executives participated in a closed-door Senate hearing trying to pass cryptocurrency legislation in the United States. Whether or not that actually changes anything, who knows, but that has been in the news during the last 24 hours. The opening price looks like it is going to challenge the 50-day EMA, and of course, that is the technical indicator that a lot of people watch. It has offered a bit of dynamic resistance as of late. So, this is a very interesting place to open up the day. If the market were to break above there, then it could add a little bit of fuel to the fire for the bulls, certainly could add a bit of confidence for them as well.
MSTR Technical Analysis
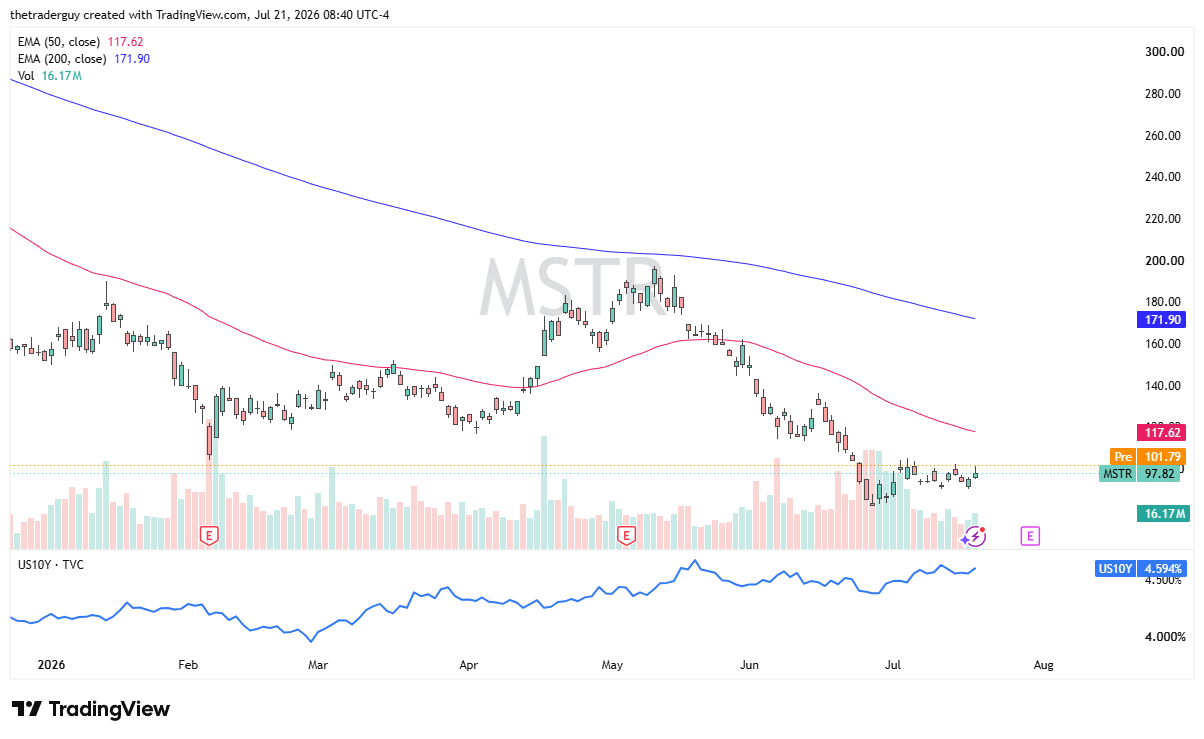
Strategy continues to just bump along in general. This is a market that has been pretty much left for dead. We are sitting just underneath the $100 a share level, and the whole lure and charm of Michael Saylor, I think, is probably not helping. At this point, the idea of just simply borrowing more money to buy more Bitcoin isn’t necessarily thought of as a business, and that is being reflected here as the cost of Bitcoin has cratered.
Quite frankly, if I want exposure to Bitcoin, I can buy it myself, which means this company is in a state of flux. They may actually have to produce something, and I think that’s the question being asked right here. This looks like dead money.
CRCL Technical Analysis
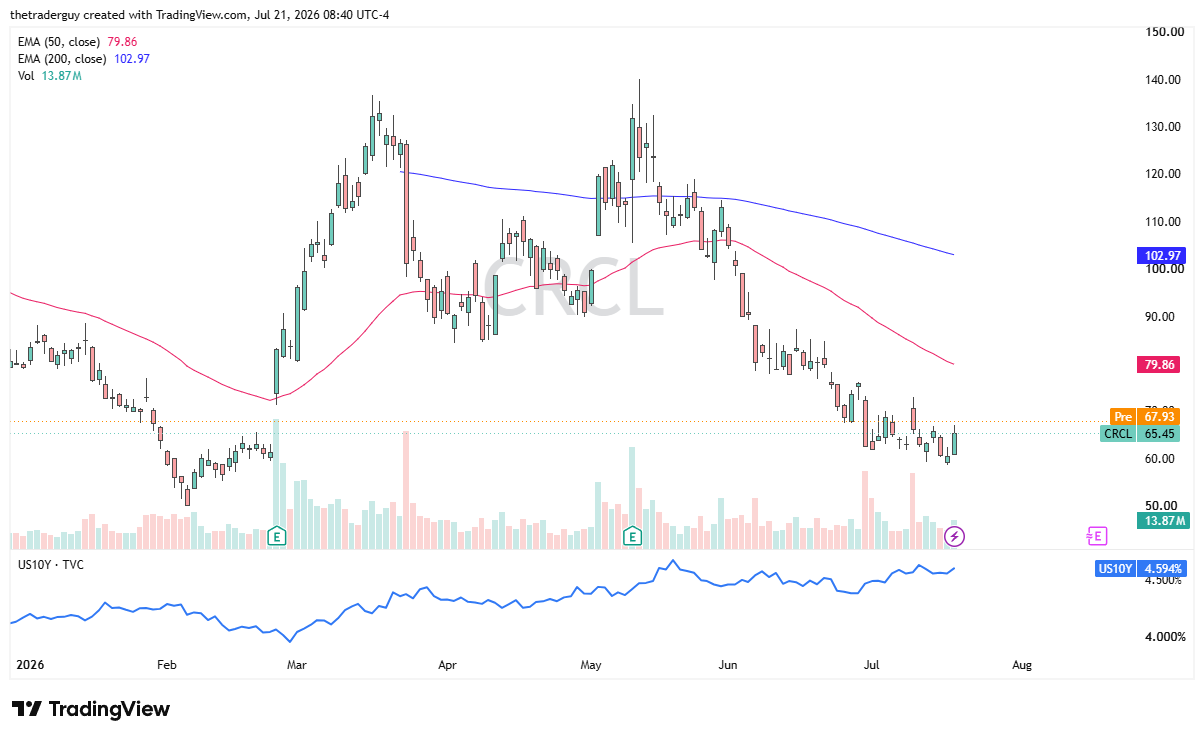
Circle looks like it’s going to benefit from a little bit of goodwill early in the morning. It is rising in pre-market trading. It did bounce from the $60 level, which was a gap from the earnings call back in February. So, we’ve done a round trip, and now it looks like that is trying to offer support. Volume was a little higher than usual yesterday, so this could be something to pay attention to. Value hunters certainly seem to be interested in Circle. It is going to have an earnings call on August 5th, so that’s the next major specific catalyst, but it may be getting a little bit of a boost from those Senate hearings yesterday, like Coinbase was.
If you’d like to know more about technical analysis and how traders use it, please visit our educational area.