Advertisement
Advertisement
DOGE and SHIB Succumb to US Economic Indicators and Hawkish Fed Speak
By:
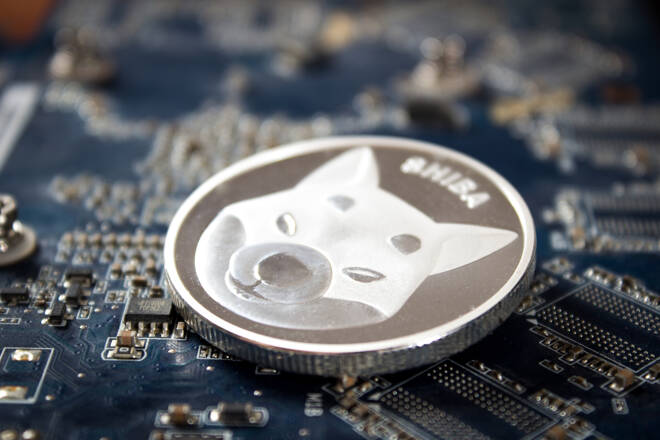
DOGE and SHIB remain under pressure following a second session in the red. Failure to move through the pivots would deliver another loss.
Key Insights:
- Dogecoin (DOGE) and Shiba Inu Coin (SHIB) saw deep red for a second consecutive session on Thursday.
- Investor sentiment towards the latest US economic indications and the Fed left the pair on the back foot.
- Despite the bearish session, the technical indicators are bullish, supporting Dogecoin’s (DOGE) number ten ranking and SHIB’s move towards the number 11 spot.
On Thursday, Dogecoin (DOGE) fell by 6.85%. Following a 7.55% slide on Thursday, DOGE ended the day at $0.07473. Shiba Inu Coin (SHIB) joined DOGE deep red, falling by 8.80% to $0.00001348. On Wednesday, SHIB declined by 6.51%.
A range-bound morning saw SHIB rise to a high of $0.00001499 before sliding to a final hour low of $0.00001319. The reversal saw SHIB fall through the First Major Support Level (S1) at $0.0000140 and briefly through the Second Major Support Level (S2) at $0.0000133.
DOGE rose to an early afternoon high of $0.08229 before sliding to a final hour low of $0.07320. DOGE fell through the First Major Support Level (S1) at $0.0767. Finding support at the Second Major Support Level (S2) at $0.0732, DOGE ended the day at $0.07473.
Market Forces Sink DOGE and SHIB on Bets of a 75-Basis Point Hike
There were no news updates to send DOGE and SHIB into the red for a second session. US economic indicators and FOMC member chatter sent the meme coins and the broader crypto market into negative territory.
In August, the Philly Fed Manufacturing Index increased from -12.3 to +6.2. The numbers were in stark contrast to the NY Empire State Manufacturing numbers. In August, the NY Empire State Manufacturing Index slid from 11.1 to -31.3.
Jobless claims were also upbeat. While falling by just 2k to 250k, the decline was the first since the week ending May 20.
With inflation elevated, the recent string of positive economic indicators eased the fear of an economic recession. However, the numbers also support another 75-basis point rate hike in September.
FOMC member chatter affirmed this, with FOMC member James Bullard leaning in favor of a 75-basis point hike. FOMC member Mary Daly, speaking early in the Thursday session, reportedly favored a 50 or 75 basis point move. Significantly, both also talked of a rise-and-hold strategy rather than reversing course.
Despite the hawkish chatter, the NASDAQ 100 ended Thursday with a 0.21% gain.
Shiba Inu Coin (SHIB) Price Action
At the time of writing, SHIB was down 0.96% to $0.00001335.
Technical Indicators
SHIB needs to move through the $0.0000139 pivot to target the First Major Resistance Level (R1) at $0.0000146 and the Thursday high of $0.00001499.
SHIB would need a bullish morning session for the broader crypto market to support a return to $0.0000140.
In the event of an extended rally, SHIB should test the Second Major Resistance Level (R2) at $0.0000157 and resistance at $0.0000160. The Third Major Resistance Level (R3) sits at $0.0000175.
Failure to move through the pivot would bring the First Major Support Level (S1) at $0.0000128 into play. Barring another extended sell-off throughout the day, SHIB should avoid sub-$0.0000125 and the Second Major Support Level (S2) at $0.0000121.
The Third Major Support Level (S3) sits at $0.0000103.
The EMAs send a bullish signal, with SHIB sitting at the 100-day EMA, currently at $0.00001358. A SHIB breakout from the 100-day EMA would support a run at the 50-day EMA ($0.00001439) and R1 ($0.0000146). However, failure to move through the 100-day EMA would bring S1 ($0.0000128) and the 200-day EMA ($0.00001271) into view.
Dogecoin (DOGE) Price Action
At the time of writing, DOGE was down 0.64% to $0.07425.
Technical Indicators
DOGE needs to move through the $0.0767 pivot to test the First Major Resistance Level (R1) at $0.0803 and the Thursday high of $0.08229.
DOGE would need a bullish morning session for the broader crypto market to support a return to $0.080.
In the event of an extended rally, DOGE should test the Second Major Resistance Level (R2) at $0.0858 and resistance at $0.090. The Third Major Resistance Level (R3) sits at $0.0949.
Failure to move through the pivot would leave the First Major Support Level (S1) at $0.0712 in play. Barring another extended sell-off throughout the day, DOGE should avoid sub-$0.070 and the Second Major Support Level (S2) at $0.0677.
The Third Major Support Level (S3) sits at $0.0586.
The EMAs sent a bullish signal, with DOGE sitting at the 100-day EMA, currently at $0.07451. A breakout from the 100-day EMA would bring the 50-day EMA (0.07750) and R1 (0.0803) into play.
However, a fall through the 100-day EMA ($0.07451) would bring the 200-day EMA (0.07187) and S1 ($0.0712) into view.
About the Author
Bob Masonauthor
With over 28 years of experience in the financial industry, Bob has worked with various global rating agencies and multinational banks. Currently he is covering currencies, commodities, alternative asset classes and global equities, focusing mostly on European and Asian markets.
Advertisement
