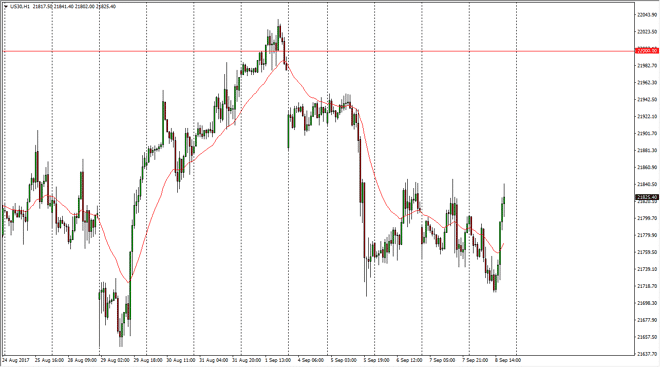
Dow Jones 30 The Dow Jones 30 initially fell on Friday but rallied a bit to reach towards the 21,850 level. Ultimately, the market should continue to be
The Dow Jones 30 initially fell on Friday but rallied a bit to reach towards the 21,850 level. Ultimately, the market should continue to be choppy, but I think eventually the buyers will come in. I like buying pullbacks, as the market seems to be well supported below. I think that the market will go looking for the 22,000-level given enough time.
The NASDAQ 100 fell a bit during the course of the session on Friday, reaching towards the 5935 level. I think the 5900-level underneath should be well supported, and more than likely the buyers will come back in. I think these pullbacks offer value, as the NASDAQ 100 has offered a bit of a leader for US indices.
Chris is a proprietary trader with more than 20 years of experience across various markets, including currencies, indices and commodities. As a senior analyst at FXEmpire since the website’s early days, he offers readers advanced market perspectives to navigate today’s financial landscape with confidence.