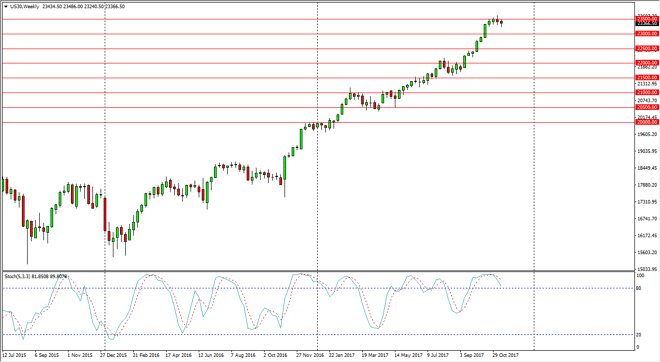
Dow Jones 30 The Dow Jones 30 fell a bit during the week, as we continue to stagnate underneath the 23,500 level. I think a pullback from here could make
The Dow Jones 30 fell a bit during the week, as we continue to stagnate underneath the 23,500 level. I think a pullback from here could make some sense, with the 23,000-level underneath being a bit of a “floor.” That floor giving way could send this market even lower, perhaps down to the 22,500 level after that. The market is a bit overbought as the stochastic oscillator has been crossing, but quite frankly I think that it’s a market that should remain bullish longer term. I think we are waiting for the US Congress to pass some type of tax bill, and as soon as it does, we could continue to go higher. I believe that the “floor” in the overall uptrend is closer to the 22,000 handle.
The NASDAQ 100 fell significantly during the week, reaching down to the 6200 level. We bounce from there to form a bit of a hammer, and a break above the top of the hammer should send this market much higher. The NASDAQ 100 has gotten a bit overextended, and that the market should continue to go towards the 6500 level if we can build up the necessary momentum. The NASDAQ 100 typically will lead the way for other US stock indices, so I expect to see that happen eventually. However, I believe that the floor in the uptrend is the 6000 handle, with every 100 points below offering potential support for buying as well. The NASDAQ 100 will benefit greatly from a tax bill, so if the US Congress gets it together, that could be the next catalyst to send the NASDAQ 100 much higher levels. If we were to break down below the 6000 handle, I would step out of the way.
Chris is a proprietary trader with more than 20 years of experience across various markets, including currencies, indices and commodities. As a senior analyst at FXEmpire since the website’s early days, he offers readers advanced market perspectives to navigate today’s financial landscape with confidence.