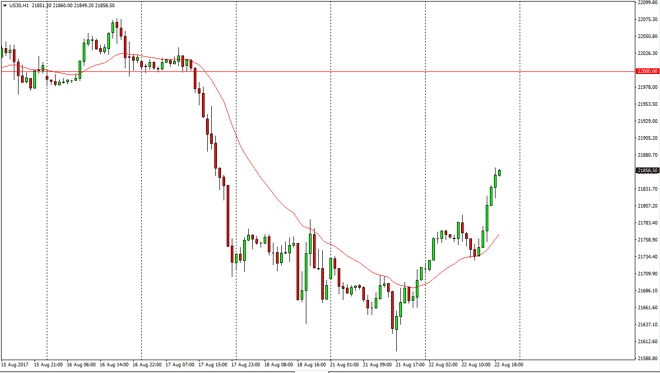
Dow Jones 30 The Dow Jones 30 was relatively quiet until the Americans jumped on board, as a report came out suggesting that perhaps tax reform was being
The Dow Jones 30 was relatively quiet until the Americans jumped on board, as a report came out suggesting that perhaps tax reform was being worked on and a bit of progress had happened. That being the case, it’s likely that the market will continue to look at anything tax related as a catalyst to go higher. The 22,000 level above should offer resistance though, so I think this is a short-term move to the upside.
The NASDAQ 100 broke out and above the 5825 handle, and now looks to reach towards the 5900 level above. That is a massive amount of resistance just waiting to happen, so I don’t know if we can break above there. If there is a break above there, then it is a bullish sign. Ultimately, I think that if we get an exhaustive looking candle, it might be a nice short-term selling opportunity.
Chris is a proprietary trader with more than 20 years of experience across various markets, including currencies, indices and commodities. As a senior analyst at FXEmpire since the website’s early days, he offers readers advanced market perspectives to navigate today’s financial landscape with confidence.