The stock markets in the United States rallied again during the trading session on Thursday, as we continue to extend runs to the upside. It looks likely that the market is due for a pullback, but right now the buyers are most certainly in control.
The Dow Jones 30 shot higher during the trading session on Thursday, reaching above the 24,000 level as markets continue to explode to the upside. We are bit overbought, so in a runaway market like this, your best bet is to wait for pullbacks to buy and pick up value. Unfortunately, we have not gotten much in the way of pullbacks lately, but I suspect that the 24,000 level will be supportive, so therefore any type a pullback should be a potential opportunity. At this point, I would not be a buyer simply because it would be chasing the trade, and chasing the trade is one of the best ways to lose money.
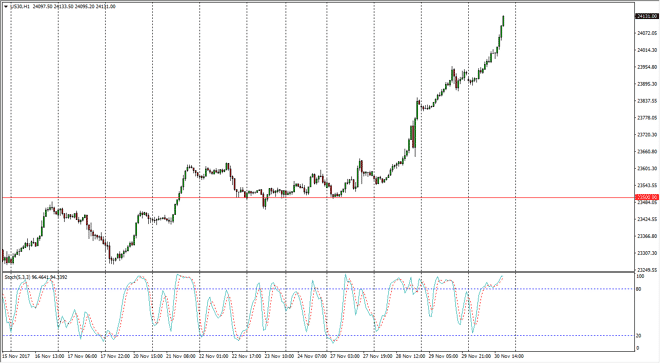
The NASDAQ 100 also rallied significantly, but as I record this we are starting to form a bit of an exhaustive candle on the hourly chart, and have crossed over in the overbought section of the stochastic oscillator. As a classic technical analysis signal to sell, and after the brutalizing of the NASDAQ 100 during the Wednesday session, it makes sense that we would continue to see bearish pressure. Because of this, I believe that a breakdown below the 6325 level sends the NASDAQ 100 back down to the 6290 handle again. Alternately, if we do continue to the upside, I believe that the 6400 level will also be massively resistive, so therefore I’m not interested in buying the NASDAQ 100 quite yet. In general, I believe that the stock markets are overbought, so looking for value is probably the best way to go long. If you are a short-term trader though, we may get a selling opportunity.
Chris is a proprietary trader with more than 20 years of experience across various markets, including currencies, indices and commodities. As a senior analyst at FXEmpire since the website’s early days, he offers readers advanced market perspectives to navigate today’s financial landscape with confidence.