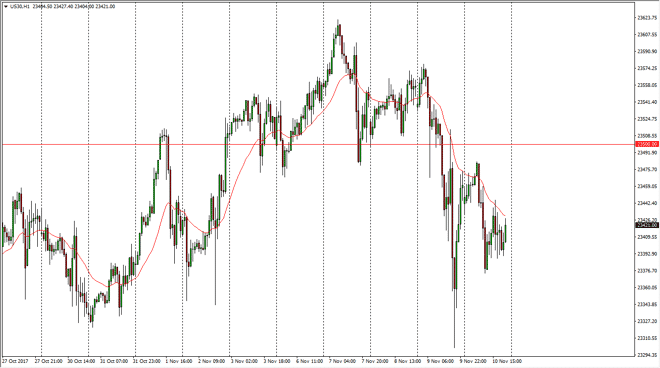
Dow Jones 30 The Dow Jones 30 fell initially during the trading session on Friday but did bounce a little bit towards the end of the day. I believe that
The Dow Jones 30 fell initially during the trading session on Friday but did bounce a little bit towards the end of the day. I believe that the market is going to continue to see a lot of volatility and I prefer shorting exhaustive rallies on short-term charts. I don’t think that we are going to be able to continue the uptrend without some type a pullback because quite frankly the markets are getting ahead of themselves. That doesn’t mean that I’m willing to short this market in large positions, just that I may switch to a shorter-term trading regiment with small position sizing. I think that the 23,000-level underneath would make an excellent target for some type of rebound in the longer-term uptrend, but currently, I’m focusing on the small moves as I think they are more likely to be seen.
The NASDAQ 100 fell during the session as well but broke above the 6300 level again. This is a market that is slowing down because quite frankly it’s a bit overextended. The market as you can see has continued to find buyers every time we dip, and I think that will be the case as well, but I also recognize that the market is overbought from the longer-term perspective, so it’s probably best to step away from this market until some clarity comes back. Quite frankly, we have seen so much in the way of bullish pressure that it’s difficult to sell, but I certainly think that at this point we have come too far into short of the period to feel comfortable about buying what could be essentially at the top, or at the very least chasing the trade. While I am bullish longer-term, I recognize that we need to find some type of value underneath.
Chris is a proprietary trader with more than 20 years of experience across various markets, including currencies, indices and commodities. As a senior analyst at FXEmpire since the website’s early days, he offers readers advanced market perspectives to navigate today’s financial landscape with confidence.