Dow Jones 30
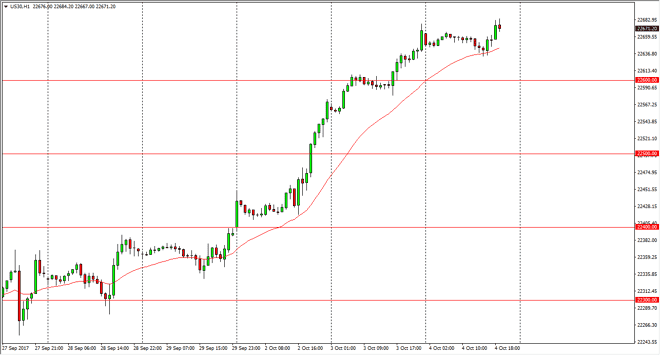
The Dow Jones 30 went sideways initially during the Wednesday trading session, as we continue to see strength just below. The 24-hour exponential moving average has offered support on the hourly chart, and although we have drifted sideways more than anything else, I think that it’s only a matter of time before the buyers return. I look at the 22,600 level as a bit of support now. We have seen a recent move from tech stocks to the overall industrial sector, and that of course will help the Dow Jones 30. However, this day was probably more about building out confidence than anything else, and the sideways session certainly help and stability to a market that rallied far too quickly for the likes of some traders. Given enough time though, I think we’re going towards the 23,000 level over the next several weeks.
Dow Jones 30 and NASDAQ Index Video 05.10.17
NASDAQ 100
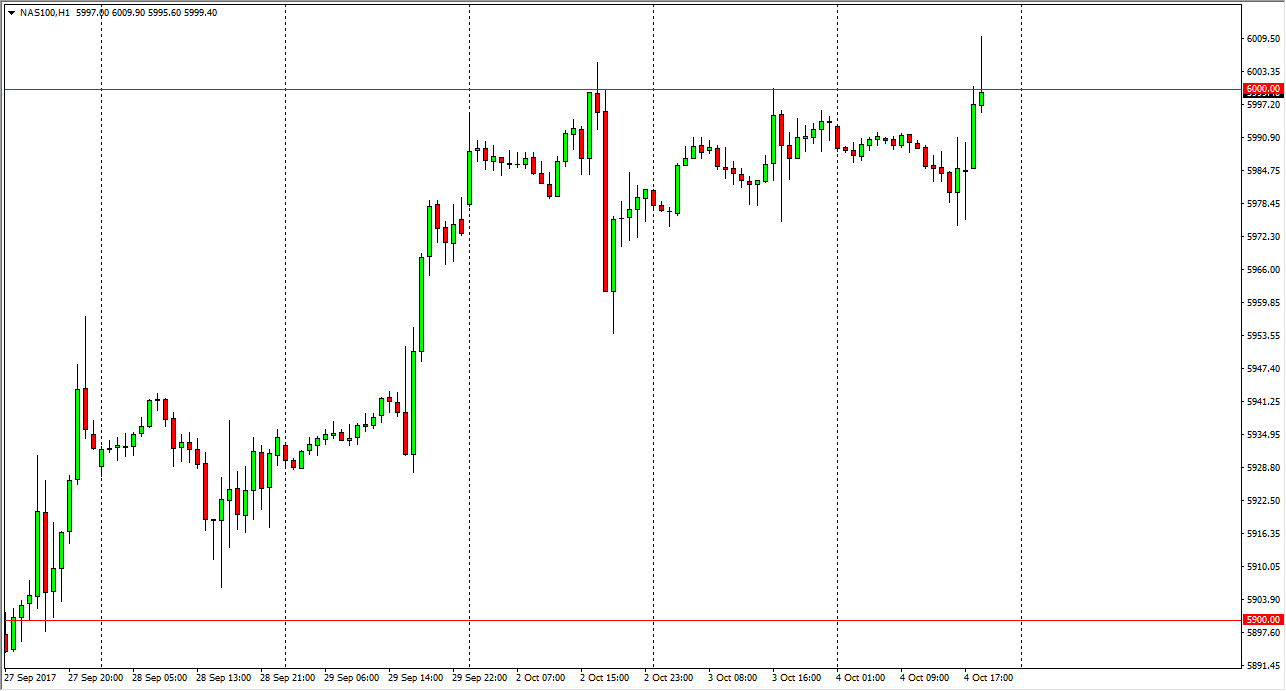
The NASDAQ 100 broke above the 6000 level during the Wednesday session, but pulled back as we found resistance in that area. Simply put, if we can break above the shooting star on the hourly chart, I am a buyer as I think we will finally cleared a major resistance. In other words, if we can clear the 6010 level, the markets will continue to the upside. Recently, we have seen the market building up pressure to the upside, and eventually it looks as if the sellers will give way. Once that happens, it will probably be a very sudden move, as the resistance has been so strong. Because of this, the market should continue to find plenty of support underneath as this is becoming increasingly obvious to the trading community. Selling isn’t a thought, and I believe that the 5980 level is going to offer plenty of support underneath.