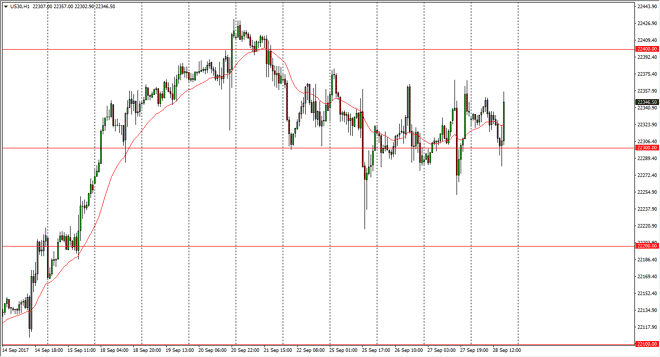
Dow Jones 30 The Dow Jones 30 initially fell during the day on Thursday, reaching towards the 22,300 level for support. Ultimately, if we bounce from
The Dow Jones 30 initially fell during the day on Thursday, reaching towards the 22,300 level for support. Ultimately, if we bounce from there, the market should continue to go higher. The explosion towards the upside should be a good sign, and I believe that we will go looking towards the 22,400 level. If we can break above there, the market should then go to the 22,500 level. This consolidation should continue to be very constructive, as I think we are trying to reach towards much higher levels. A break above the 22,500-level census market into the next leg higher. The volatility should continue, because there are a lot of economic factors going back and forth should continue to make the Dow Jones 30 noisy. However, there seems to be a bit of a sector rotation into industrials, and that of course helps the Dow Jones 30 longer term.
The NASDAQ 100 initially fell during the day on Thursday, but found enough support at the 5900 level to turn things around and bounce. I think that the market should continue to go higher, but there is a lot of noise in this market. I think that the market is starting to struggle a little bit at the 5950 handle, but eventually the market should go to the 6000 handle. I believe that the market should continue to find plenty of buyers, as the technology companies have been beaten-down far too much. I think the given enough time, we will find plenty of reasons to go long with stocks in general, as the tax package may be coming, and that should have a positive effect on US stock markets overall. I have no interest in shorting.
Chris is a proprietary trader with more than 20 years of experience across various markets, including currencies, indices and commodities. As a senior analyst at FXEmpire since the website’s early days, he offers readers advanced market perspectives to navigate today’s financial landscape with confidence.