Dow Jones 30
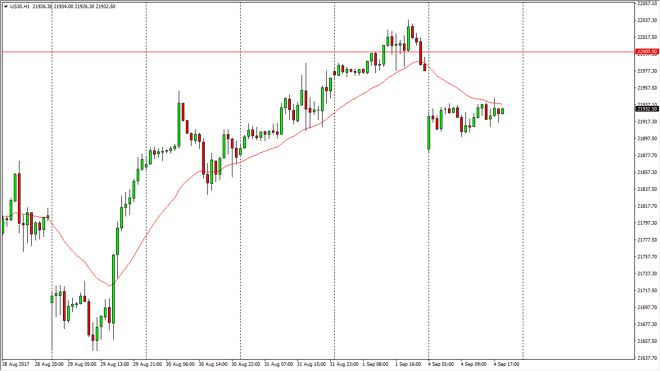
The Dow Jones 30 gapped lower at the open on Monday and reaction to the North Koreans testing a bomb, but keep in mind that this is the CFD market, and not the underlying index. The real traders have not come back, so it’s likely that we will have to wait until today to see the true reaction. Most of the time, these bomb threats tend to be ignored after a session or so, and because of this am not looking for some type of massive selloff. If we can break above the 22,000 level, the market should go much higher.
Dow Jones 30 and NASDAQ Index Video 05.9.17
NASDAQ 100
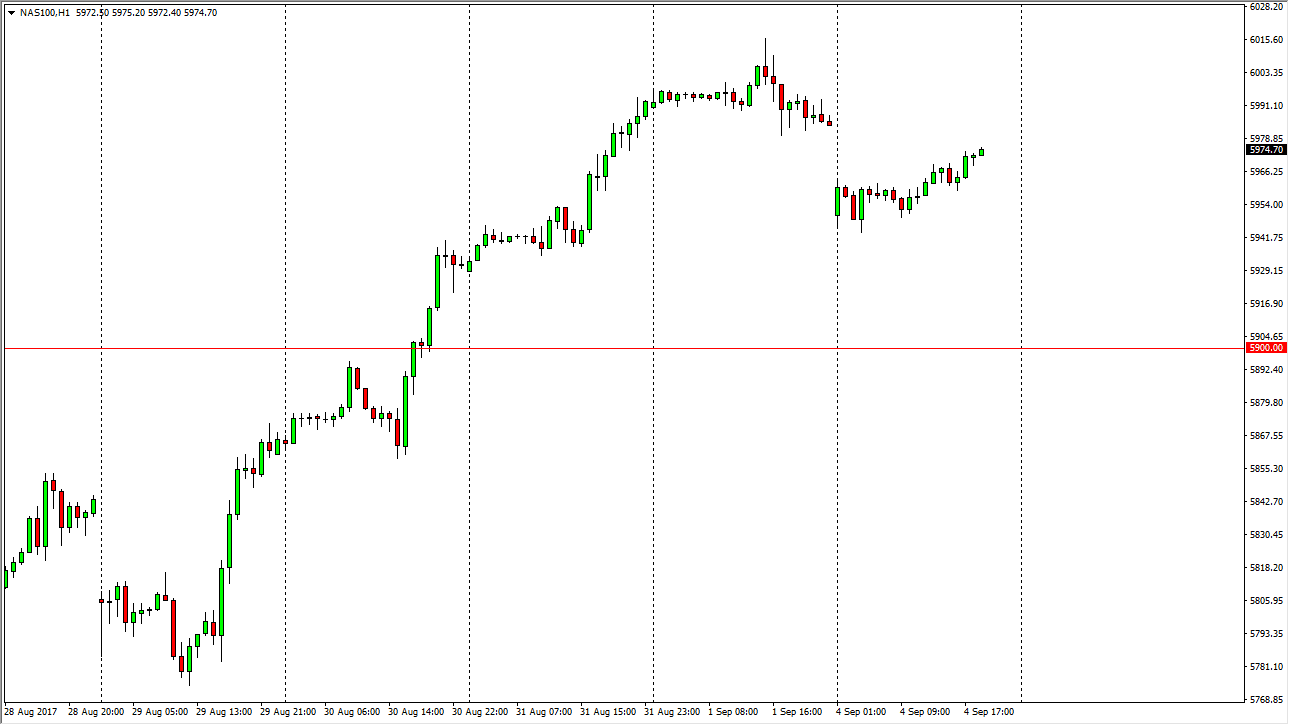
The NASDAQ 100 gapped lower as well, but again, it wasn’t the real index that we were reacting to. A break above the 6000 level should send this market much higher. I believe that the 5900-level underneath should be massive support, as the NASDAQ 100 has been a leader amongst US indices in general, and should continue to be going forward.