



The Dow Jones Industrial Average faces pressure from the surge in oil prices, elevated US Treasury yields and uncertainty over US tariffs. The exemptions for selected Canadian imports by President Trump offer limited relief and the high cost elsewhere limits those benefits. The market now turns attention to the major earnings releases next week to understand if the companies can justify AI spending. Despite these risks, the technical picture suggests some more room for recovery. In my view, the support level at 50,000 in Dow is crucial and the market must hold this support to remain bullish.
Trump’s Canadian Tariff Changes Offer Limited Relief for US Stocks
President Donald Trump signed an order to remove tariffs of 50% from selected Canadian imports. These exemptions cover plywood sheets, some paper products, machinery and refrigeration equipment and packing materials. This will take effect on 30 October. This relief may reduce cost of purchasing and protect margins for affected businesses.
But the same order adds other Canadian products to 50% tariff list. These include carpets, paints, shampoos, air conditioning machines and chest freezers.
The changes offer selective relief and raise costs elsewhere. I think this may limit the benefit for the broader stock market. Businesses still face uncertainty over the costs of imports which could make them more cautious about pricing, hiring and investment.
Despite this relief, President Trump declared import of wind turbines and their components a threat to national security. The proclamation does not impose new tariffs but it increases the uncertainty about measures in the future. This means that there might be no fresh increase in cost for now but the possible restrictions may complicate planning for energy projects in the future.
Dow Jones Price Forecast
Every new Dow Jones analysis as it publishes, today's technical signal and key levels, live price — on one page.
See all Dow Jones forecastsDow Jones Outlook: Oil Prices and Earnings Test the Recovery
Oil Prices and Treasury Yields Threaten Business Margins
The oil market remains a major threat to the US stock market in the short term. The chart below shows that Brent oil has broken the key level of $113 after forming the rounding bottom pattern.
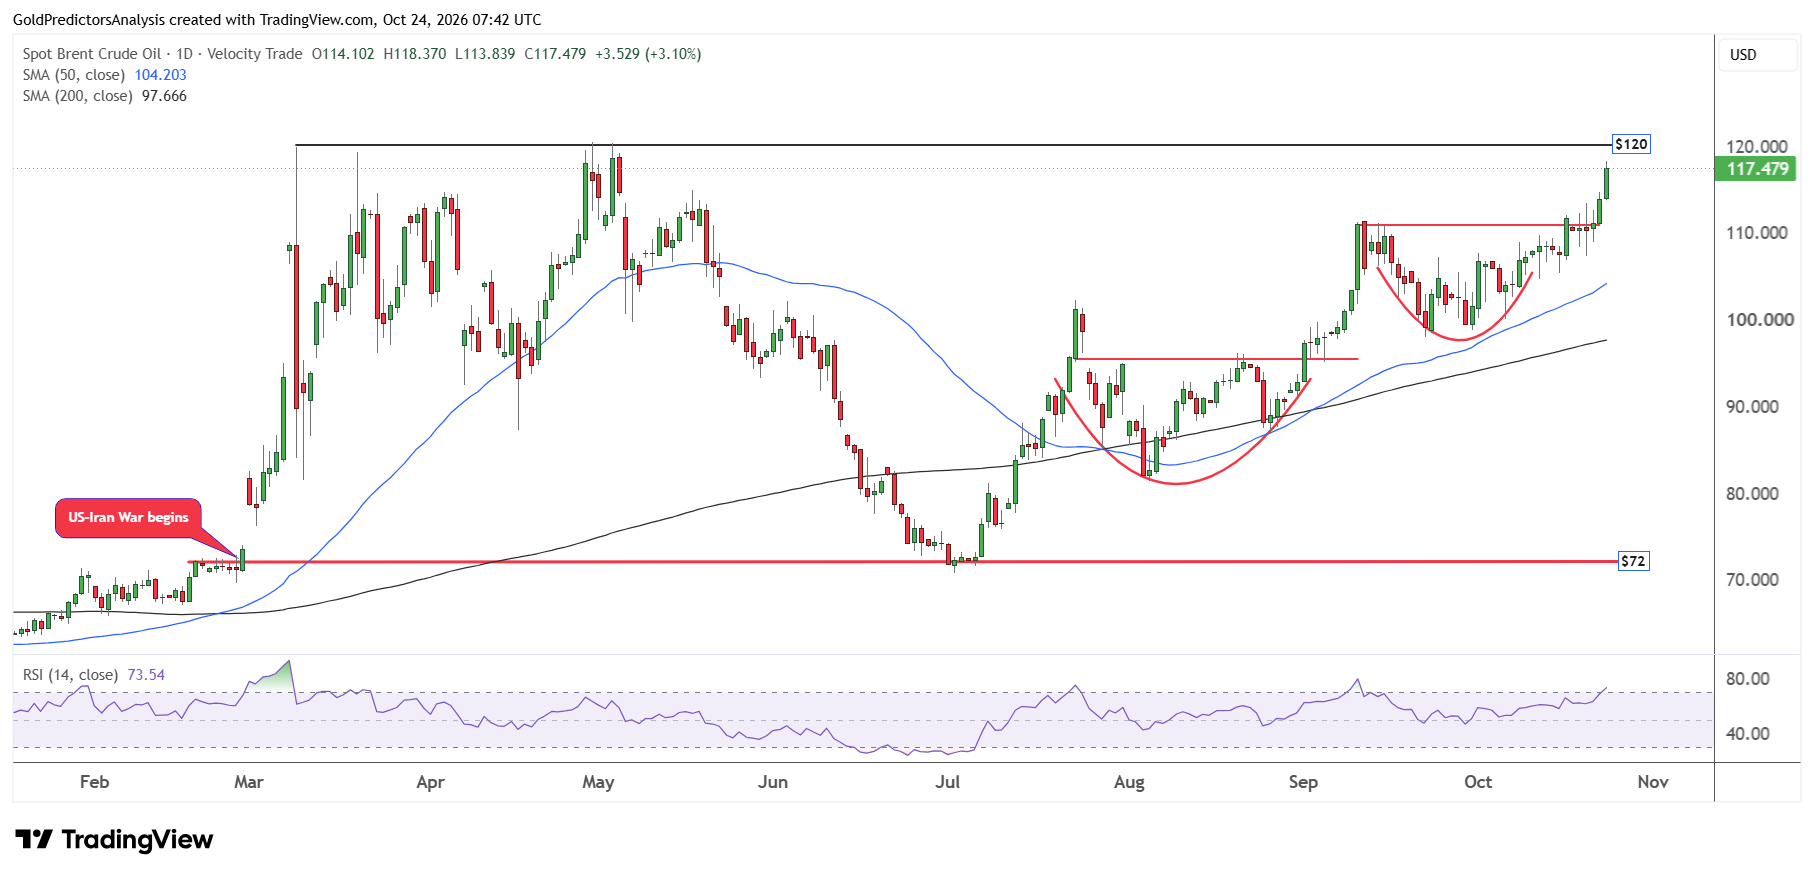
This breakout suggests that the market may remain strong next week and consolidate at higher levels near $120. This surge in oil prices is due to increased market uncertainty in the Middle East due to the recent escalation of the US-Iran war.
The 10-year US Treasury yields also rebound from the support and remain elevated. The chart below shows that Treasury yields attempt to rebound from the 50-day SMA after the recent correction. This rebound from the support creates positive outlook for Treasury yields.
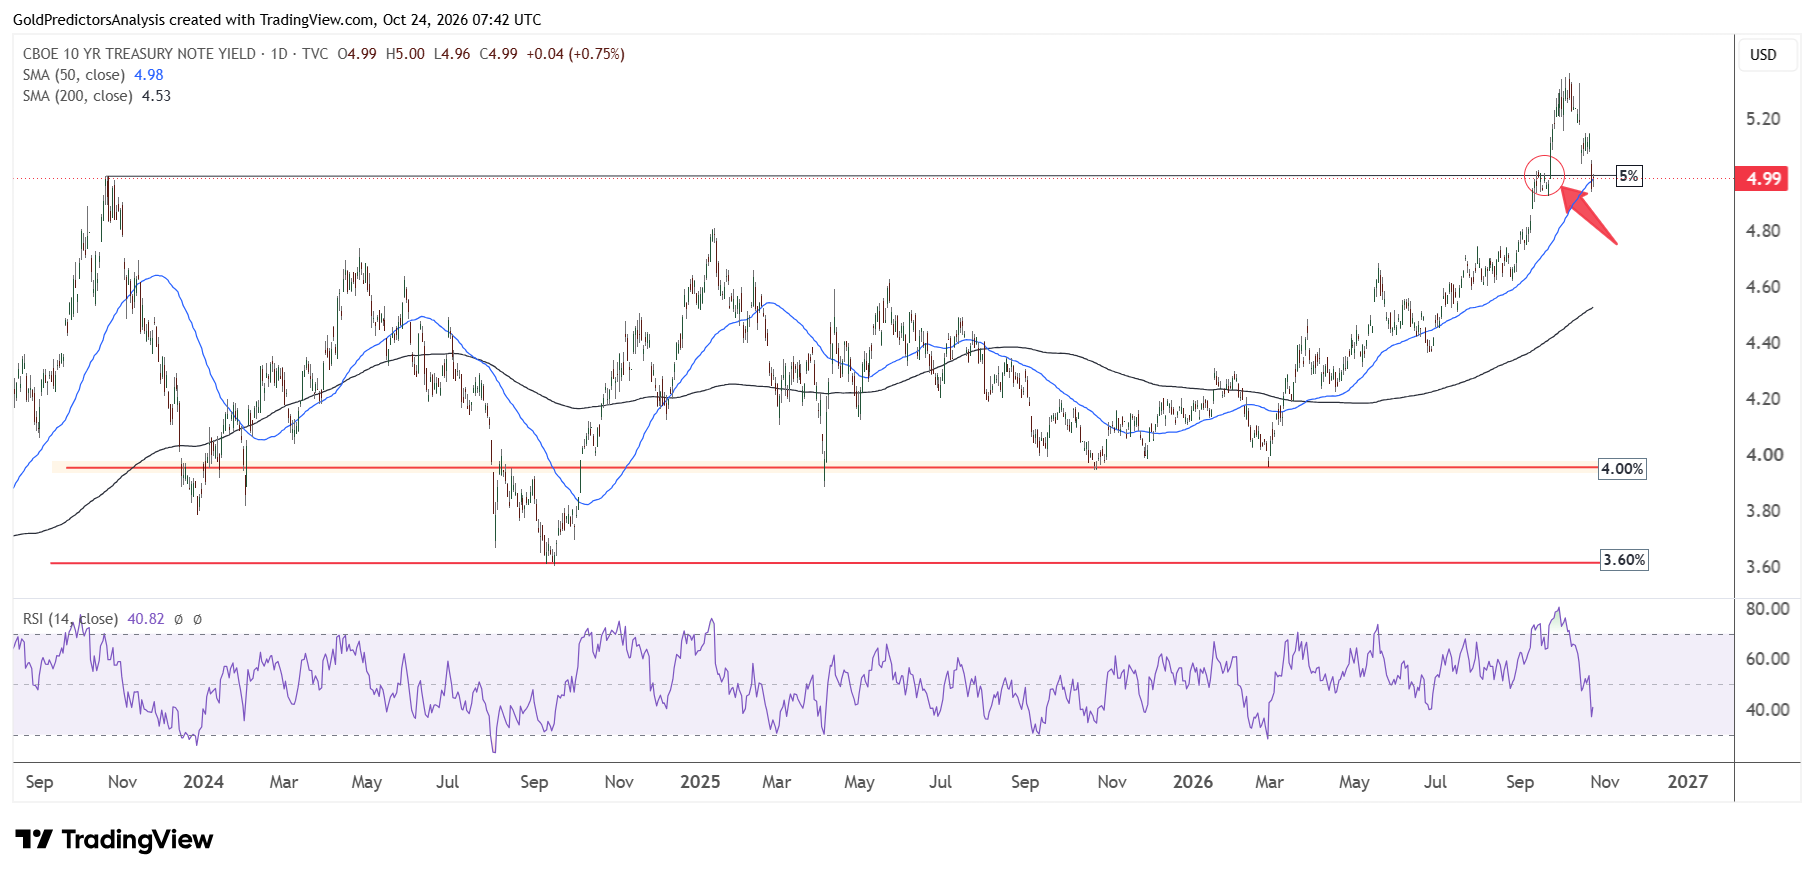
The high cost of fuel may increase costs for transport and production and may squeeze business margins. This leaves households with less money to spend on other purchases. I think that if oil prices continue to move above $120, it may create challenges for US stock market in the short term.
Strong Demand Meets Higher Business Costs
The chart below shows that US businesses face a difficult balance between growth and inflation. It is found that the flash composite PMI dropped in October to 57.6 from the high of 58.4 in September. Despite the drop in October, the PMI still remains above the 50 level which suggests expansion.
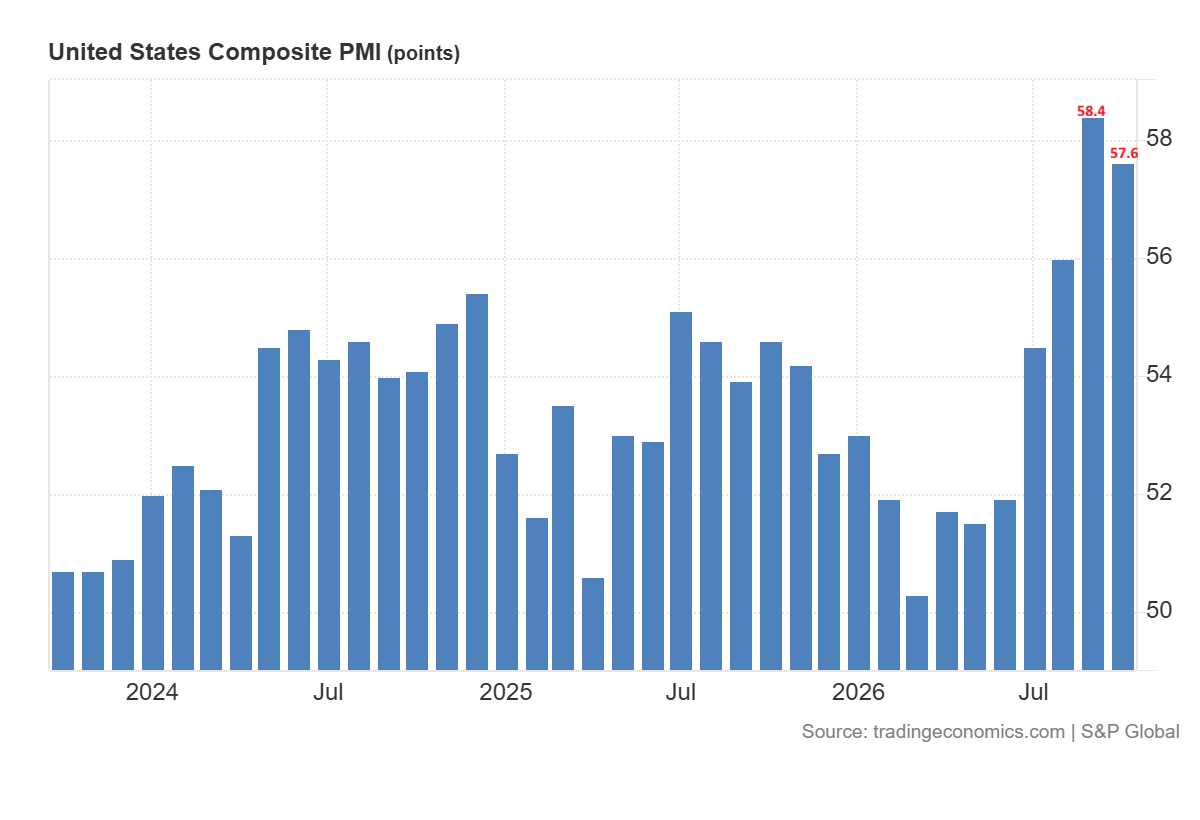
The strong demand supports healthy revenue for companies. However, the increase in oil prices and surge in expectations of higher inflation may keep monetary policy tight. The market expects the Fed to leave interest rates unchanged in October, but the expectation of rate hike in December is still high.
The latest earnings results suggest that investors remain selective. Procter & Gamble Company (PG) reported 4% growth in sales and core earnings per share increased just 1%. The high cost of operating limited the benefits of strong sales.
American Express Company (AXP) also raised the profit forecast but its shares dropped by 3.7% on Friday. This drop further extended a correction in the Dow Jones on Friday. American Express also announced plans to cut 5% of its workforce. This suggests that the cost pressure is affecting businesses and solid demand alone may not satisfy investors.
Microsoft and Amazon Earnings Put AI Spending in Focus
The AI spending concerns create substantial risk to outlook for US stocks. The chart below shows that S&P 500 Information Technology index has dropped below the 7,100.
This suggests negative price action and further downside in the technology stocks next week. This confirms that the earlier bullish signal that was triggered in September was the fake breakout.
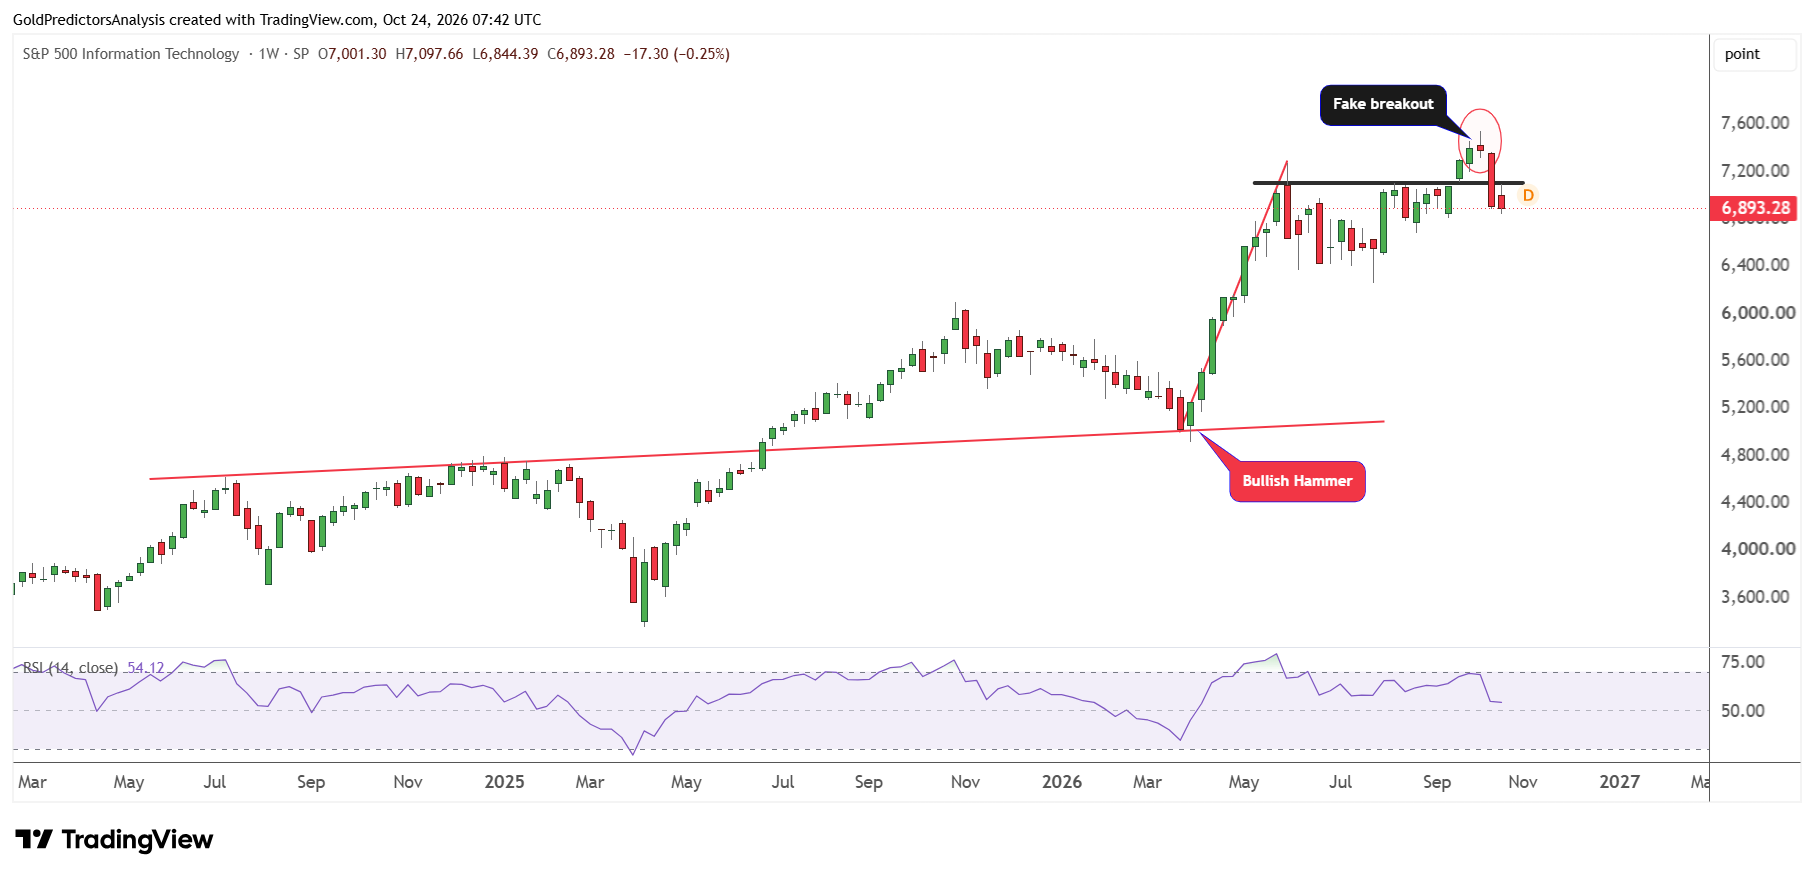
The technology selloff last week exposed doubts about the cost of financing and returns from large AI projects in the future. Microsoft Corp. (MSFT) and Amazon Inc. (AMZN) will release earnings next week. These earnings will further provide clues about the spending plans and the outlook for growth that are important for Dow Jones.
If the growth in revenue is strong, it may restore the confidence. The high cost of investment without clear profit margins may trigger further selling in stocks. In my view, the outlook for Dow Jones remains uncertain in the near term due to the major earnings release and surge in oil prices.
Dow Jones Technical Analysis: A Break Above 53,000 Could Target 55,000
Weekly Chart: 50,000 Remains the Key Support
From a technical perspective, the Dow Jones index has produced a rebound from the low of 50,507 and rallied to reach a high in October at 52,974. The index has produced sharp shadows on the weekly candles over the past two weeks. But the support at 50,000 is considered strong support.
If the index continues to rally above the 53,000 level, it will likely indicate a move towards the 55,000 area. On the other hand, a break below the 51,000 level will push the index towards 50,000.
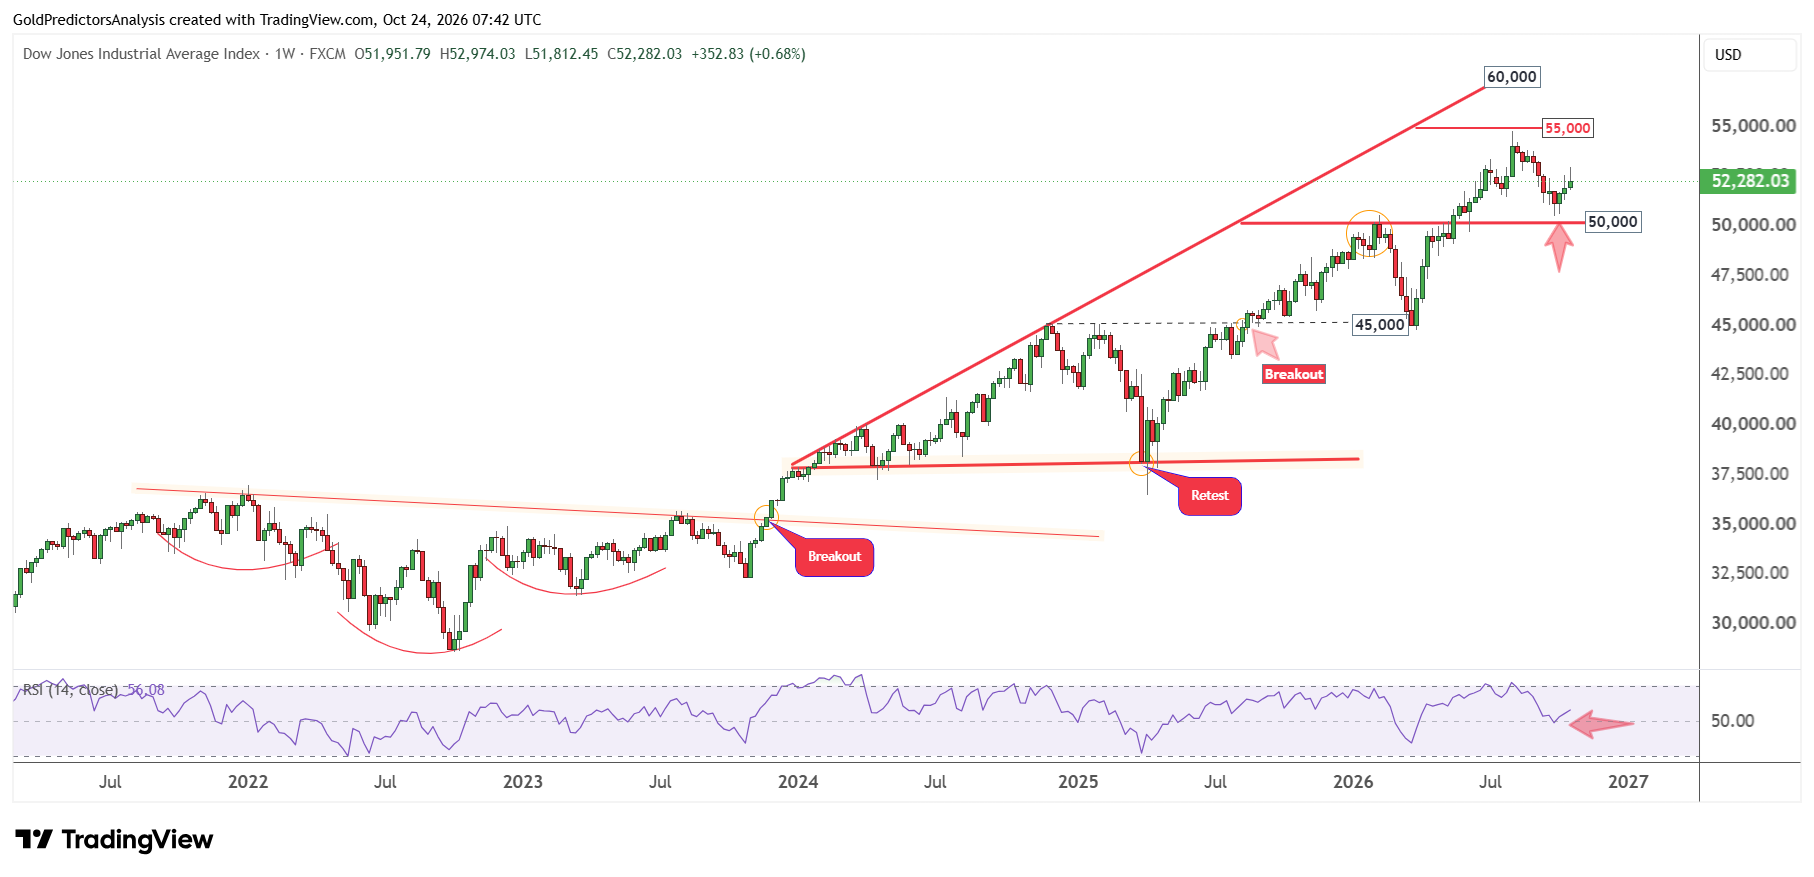
However, the RSI is rebounding from the mid-level, which suggests constructive price action and positive rally during the next few weeks.
Overall, the index has formed bullish constructive price action as seen by the inverted head and shoulders pattern from September 2021 to November 2023. Then, the formation of the ascending broadening wedge pattern stretching from January 2024 further supports this outlook. Therefore, if the index continues to hold the 50,000 area, it will likely continue to rally towards 55,000 and then the 60,000 region.
Daily and 4-Hour Charts: 53,000 Marks the Next Breakout Level
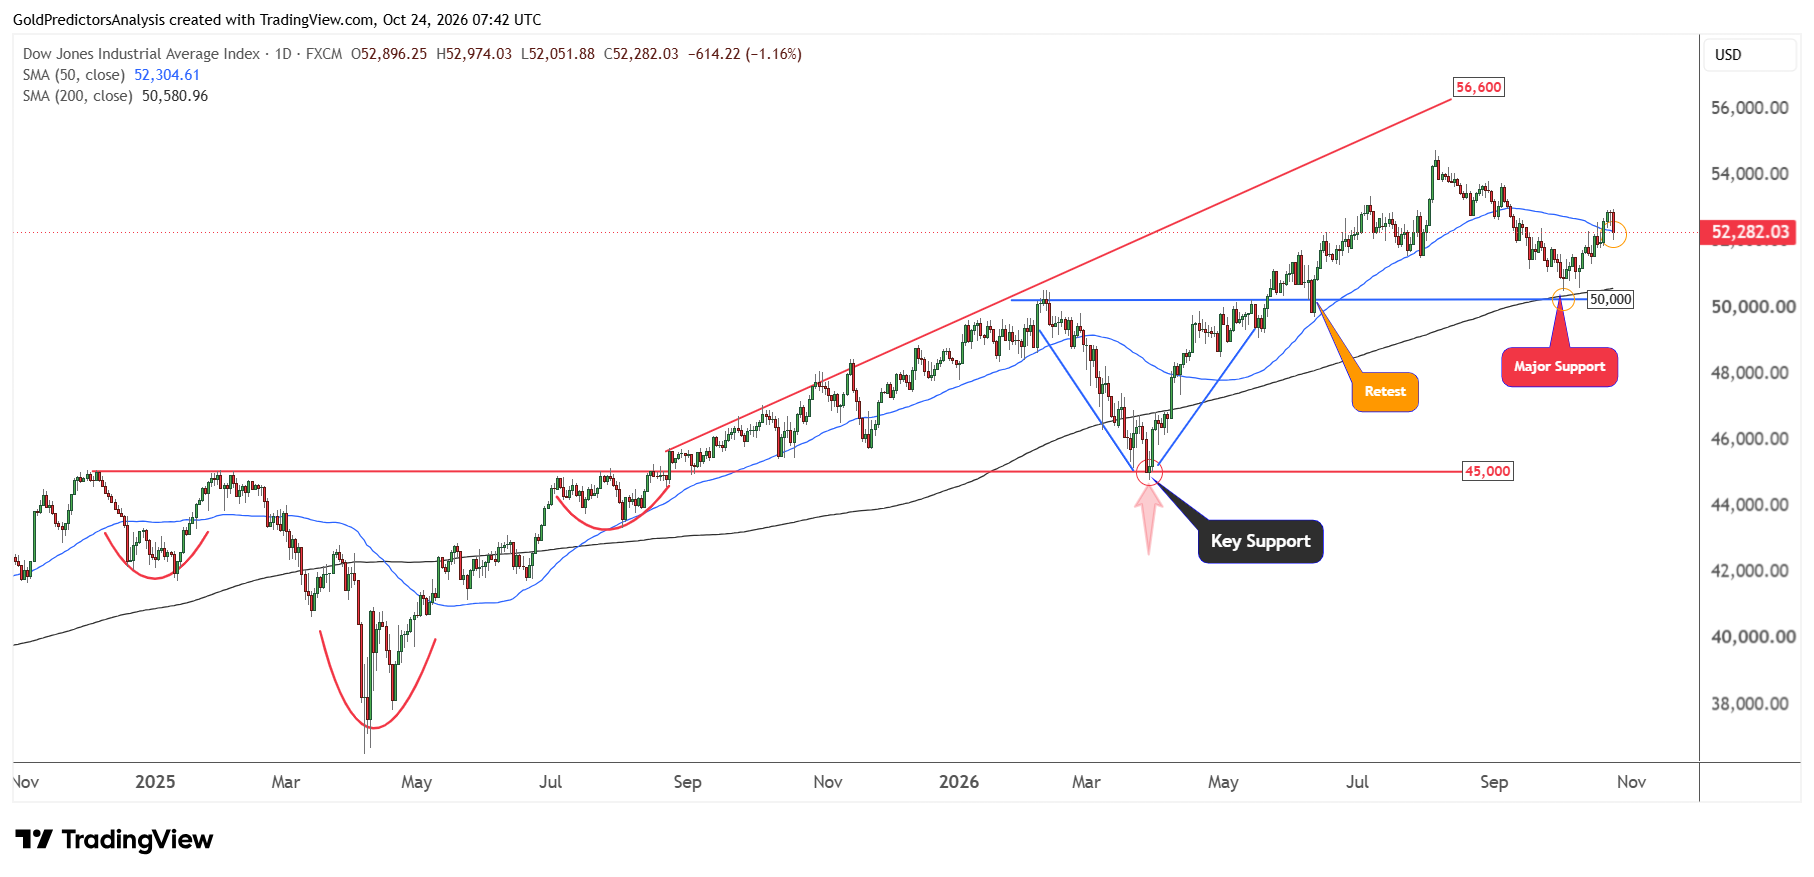
The bullish price action is also observed on the daily chart which shows the formation of inverted head and shoulders pattern from December 2024 to August 2025. The index also formed V-shaped recovery in April and May 2026. The price hit the 200-day SMA on 1 October 2026 after a correction from record highs.
The index has rebounded from the 200-day SMA and closed above the 50-day SMA, which suggests a positive rally. The reversal on Friday also managed to close right near the 50-day SMA.
The 4-hour chart shows that the index has broken the descending trend line that stretches from the August 2026 highs. Now, the index has retested this red dotted trend line and produced a rebound.
If the index recovers next week above 53,000, it will likely continue to move towards the 53,700 level in the short term. However, if the index continues to drop below the 51,000 level, it will suggest further downside towards the 50,000 area.
What to Watch Next
The surge in oil prices last week due to the escalation of the Middle East crisis and the elevated Treasury yields create risk for business margins. This situation creates mixed outlook for the Dow Jones. The tariff exemptions remain selective and reduce the cost for only some firms but the broader relief still remains limited.
The earnings for major AI firms next week may help investors to judge if the growth can support profits and justify the major spending for AI. The strong sales can not lift stocks and the high costs continue to squeeze margins.
In my view, the outlook for Dow Jones remains constructive as long as the index remains above 50,000. A clear break above 53,000 will open the way for a rally to 55,000 and 60,000 levels. But the breakdown below 51,000 may push the index to 50,000. The market needs strong earnings and lower oil prices to gain confidence and provide a rally to 55,000.