



Broad Sell-Off Pushes Dow Into Correction
The Dow Jones Industrial Average fell nearly 950 points on Friday as the selling in technology stocks continued to spread. The blue-chip average closed more than 10% below its record close, putting it in correction territory.
The Dow finished at 48147.33, down 949.73 or 1.93%. The average had already fallen below 50000 on Thursday for the first time since June. Friday’s decline left it just above its 2025 close at 48063.28.
The Dow lost 8% for the week, its steepest weekly decline since March 2020. Investors had been hoping Nvidia’s earnings would turn the tide for AI stocks. It didn’t. The sell-off picked up after Reuters reported the SEC was looking into possible accounting issues at the company. Meanwhile, the December 9 Fed meeting is hanging over the market. The FedWatch tool has the odds of a rate hike above 90%, and that’s making it harder for buyers to step in with any conviction.
Nvidia fell about 14% on Friday after Reuters reported that the Securities and Exchange Commission was exploring possible accounting issues at the company. The stock remained under pressure despite its better-than-expected earnings report earlier in the week.
Walmart Holds Up During Sell-Off
Not every Dow stock went down. Walmart rose. Johnson & Johnson and Procter & Gamble each gained about 1%. Buyers showed up for consumer and healthcare names even as the rest of the market fell apart. It wasn’t enough to offset the damage. But the message was clear. Money is moving toward stocks that can hold up if the economy rolls over.
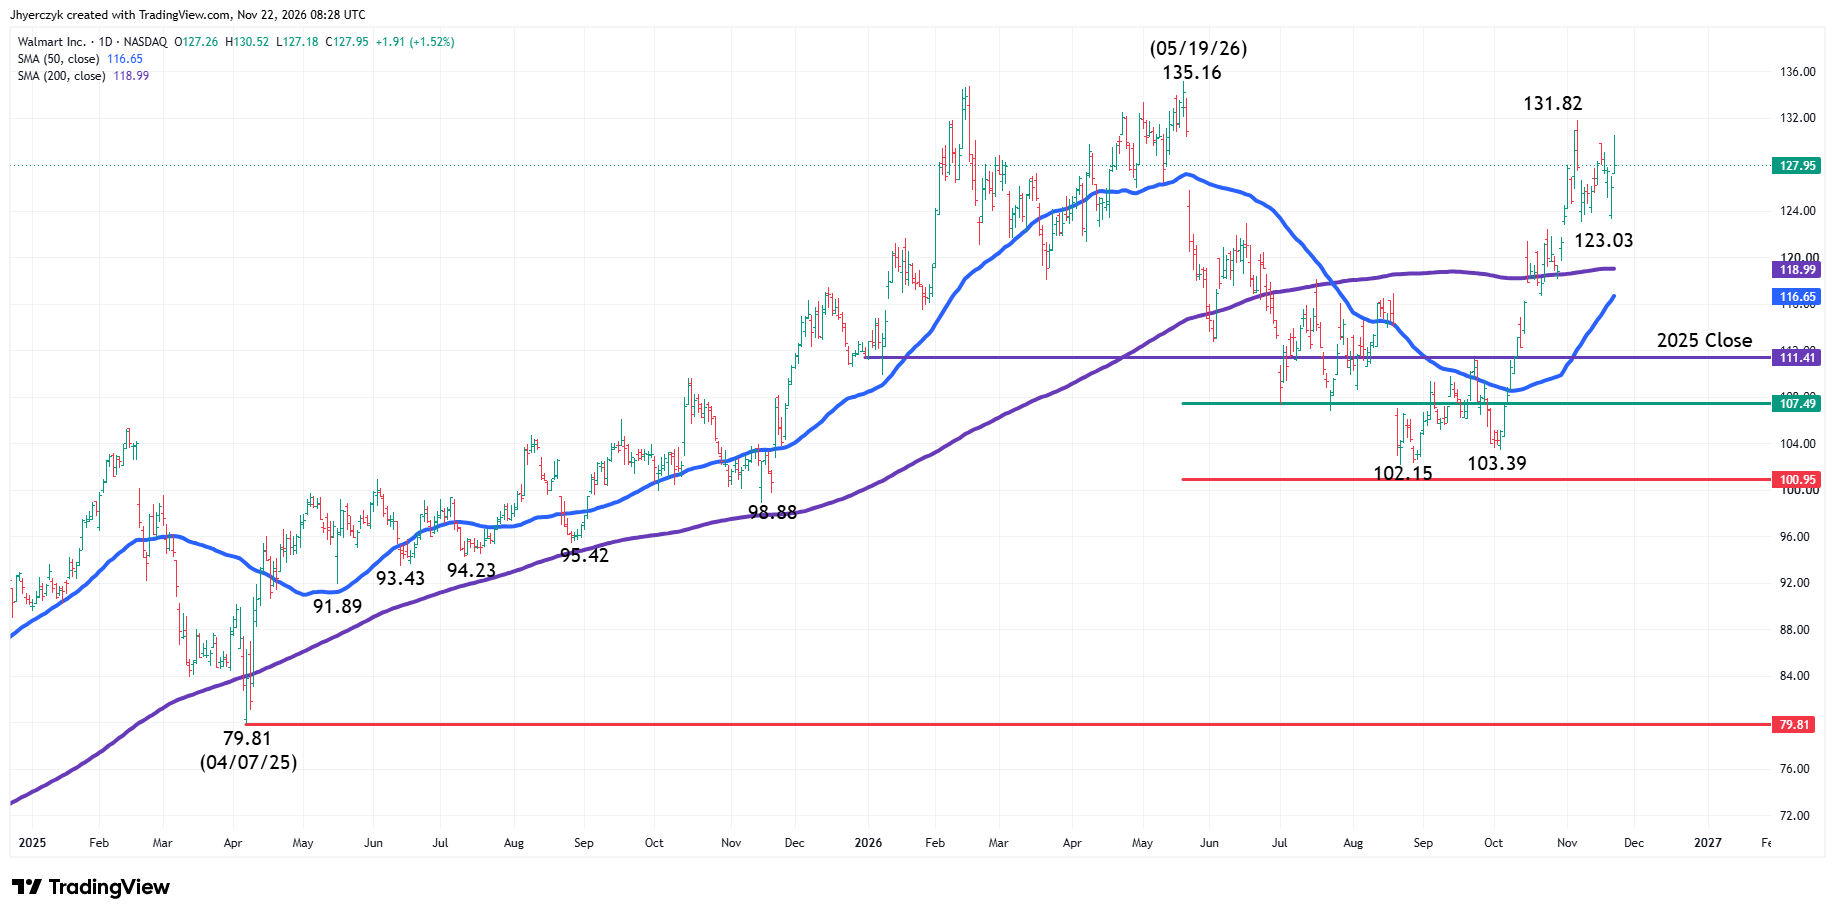
Technically, Walmart closed Friday at $127.95, up $1.91 or 1.52%. The stock is trading above its 2025 close at $111.41 and both its 50-day moving average at $116.65 and 200-day moving average at $118.99.
The main trend is up according to the daily swing chart. A trade through $131.82 will signal a resumption of the uptrend. The May 19 high at $135.16 is the next upside target. The nearest swing bottom is $123.03.
Dow Jones Price Forecast
Every new Dow Jones analysis as it publishes, today's technical signal and key levels, live price — on one page.
See all Dow Jones forecastsCaterpillar Hit by AI Spending Concerns
The selling in AI-related stocks has reached more than just the chipmakers. Companies that supply equipment and power systems for data centers have also come under pressure. Caterpillar fell 5% on Friday as investors questioned demand from the data center buildout.
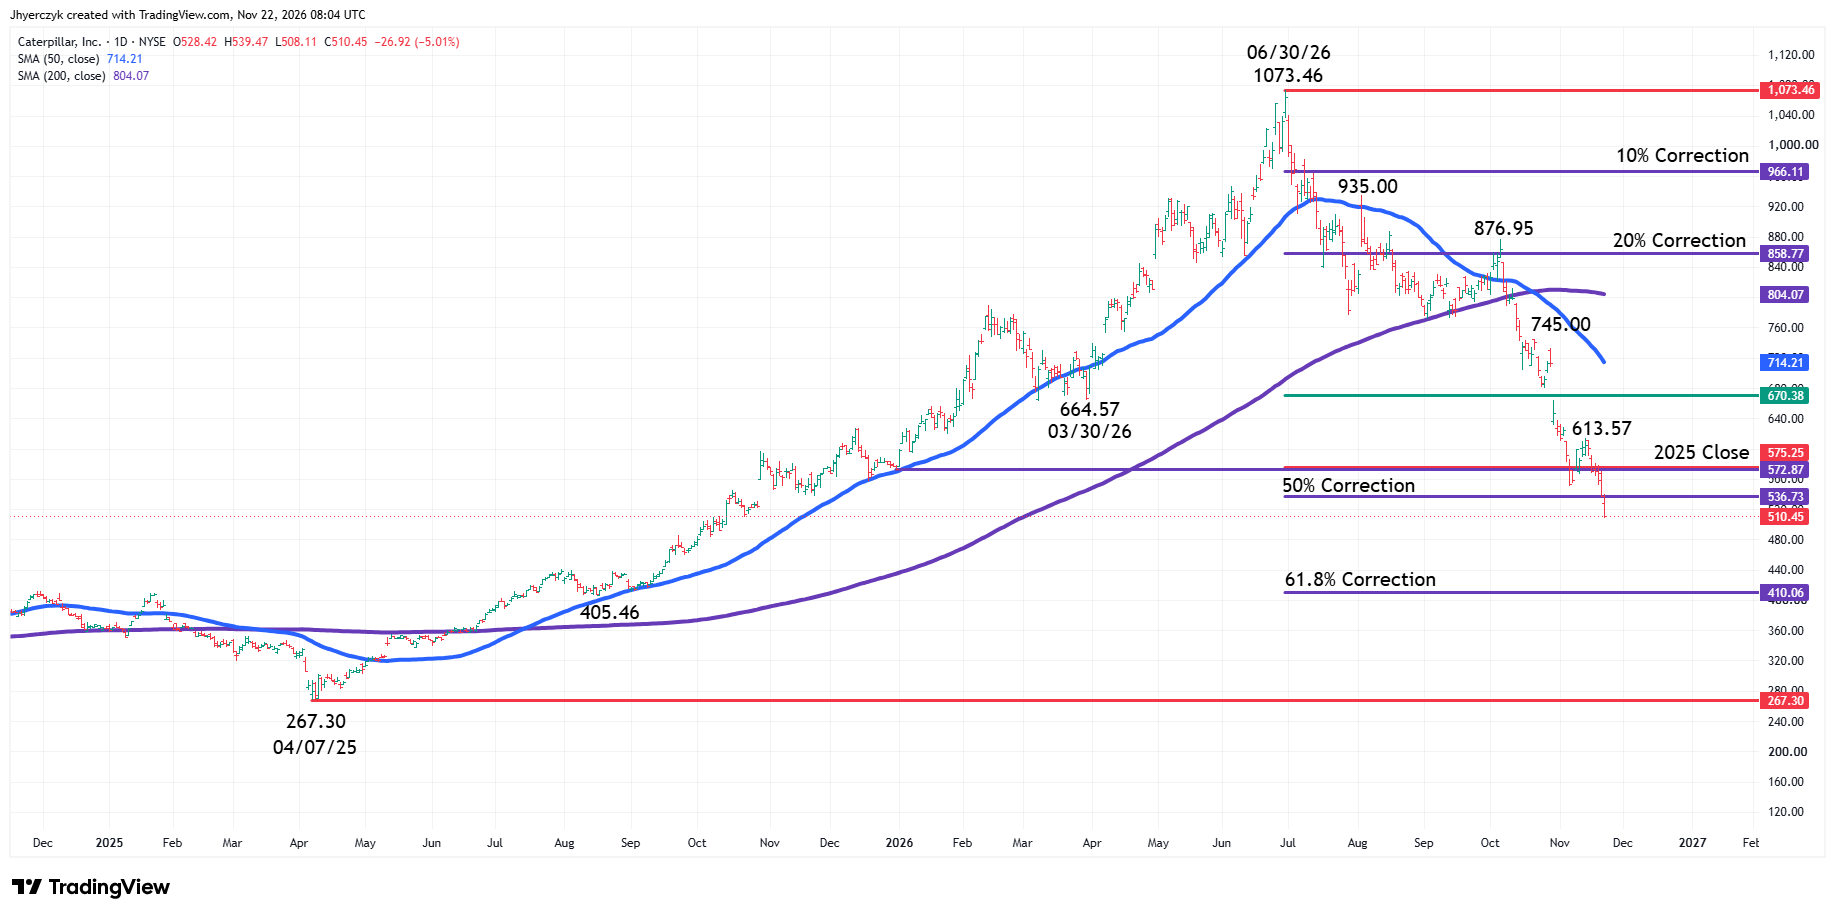
Technically, Caterpillar closed Friday at $510.45, down $26.92 or 5.01%. The stock reached an intraday low at $508.11. It is down more than 50% from its June 30 high at $1073.46.
The main trend is down. Caterpillar is trading below its 2025 close at $572.87 and the 50% decline level at $536.73. The 61.8% decline level is $410.06.
Daily Dow Jones Industrial Average Technical Analysis
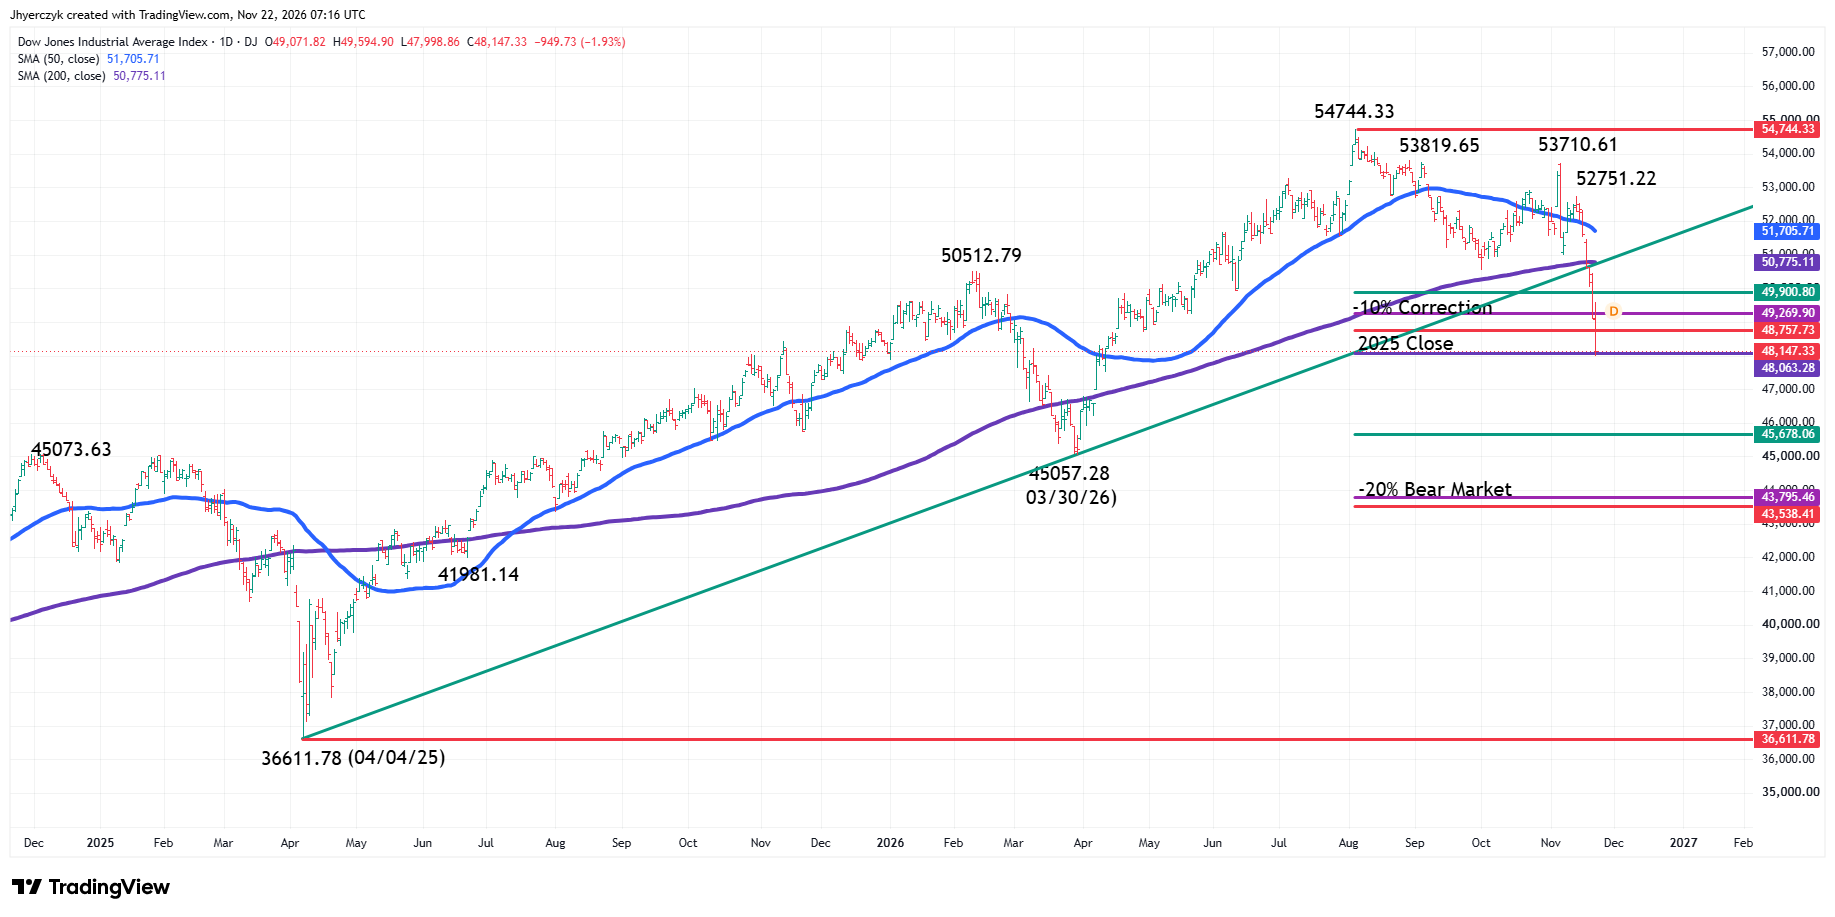
The main trend is down according to the daily swing chart. A trade through Friday’s low at 47998.86 will signal a resumption of the downtrend. The nearest swing top is 52751.22.
The Dow traded below its 2025 close at 48063.28 on Friday, but recovered to close at 48147.33. The index remains higher for the year.
The Dow is trading below the 50-day moving average at 51705.71 and the 200-day moving average at 50775.11. It also broke the uptrending line drawn from the April 4, 2025 bottom at 36611.78 through the March 30, 2026 bottom at 45057.28.
The index closed below the 10% correction level at 49269.90. The 20% decline level is 43795.46.
The intermediate range is 45057.28 to 54744.33. The Dow closed below its retracement zone at 49900.80 to 48757.73.
The long-term range is 36611.78 to 54744.33. Its retracement zone is 45678.06 to 43538.41. Inside this zone are the March 30 bottom at 45057.28 and the 20% decline level at 43795.46.
What to Watch
I’ll be watching whether buyers return to Caterpillar and the other industrial stocks, or continue to favor defensive names.
Walmart
My bias is to the upside. A move through $131.82 will strengthen my bullish outlook and put $135.16 on the radar. A break below $123.03 will weaken my upside bias.
Caterpillar
My bias is to the downside. A trade through $508.11 will signal a resumption of the decline and put $410.06 on the radar. Recovering $536.73 will weaken my bearish outlook.
Dow Jones Industrial Average
My bias will be to the downside at the start of the week because the main trend is down and the Dow is trading below its uptrending line and both moving averages.
A trade through 47998.86 will strengthen my bearish outlook. The first major downside target is 45678.06, followed by the March 30 bottom at 45057.28.
Recovering 48757.73 will weaken my downside bias. The next upside targets are 49269.90 and 49900.80. The 200-day moving average at 50775.11 is potential resistance.
More Information in our Economic Calendar.