



June E-mini Dow Jones Industrial Average futures are called higher based on the pre-market trade. The market is being supported by optimism over earnings, an easing of tensions over North Korea and a potential trade war between the United States and China. Basically, the relative calm in the markets is increasing demand for higher risk assets.
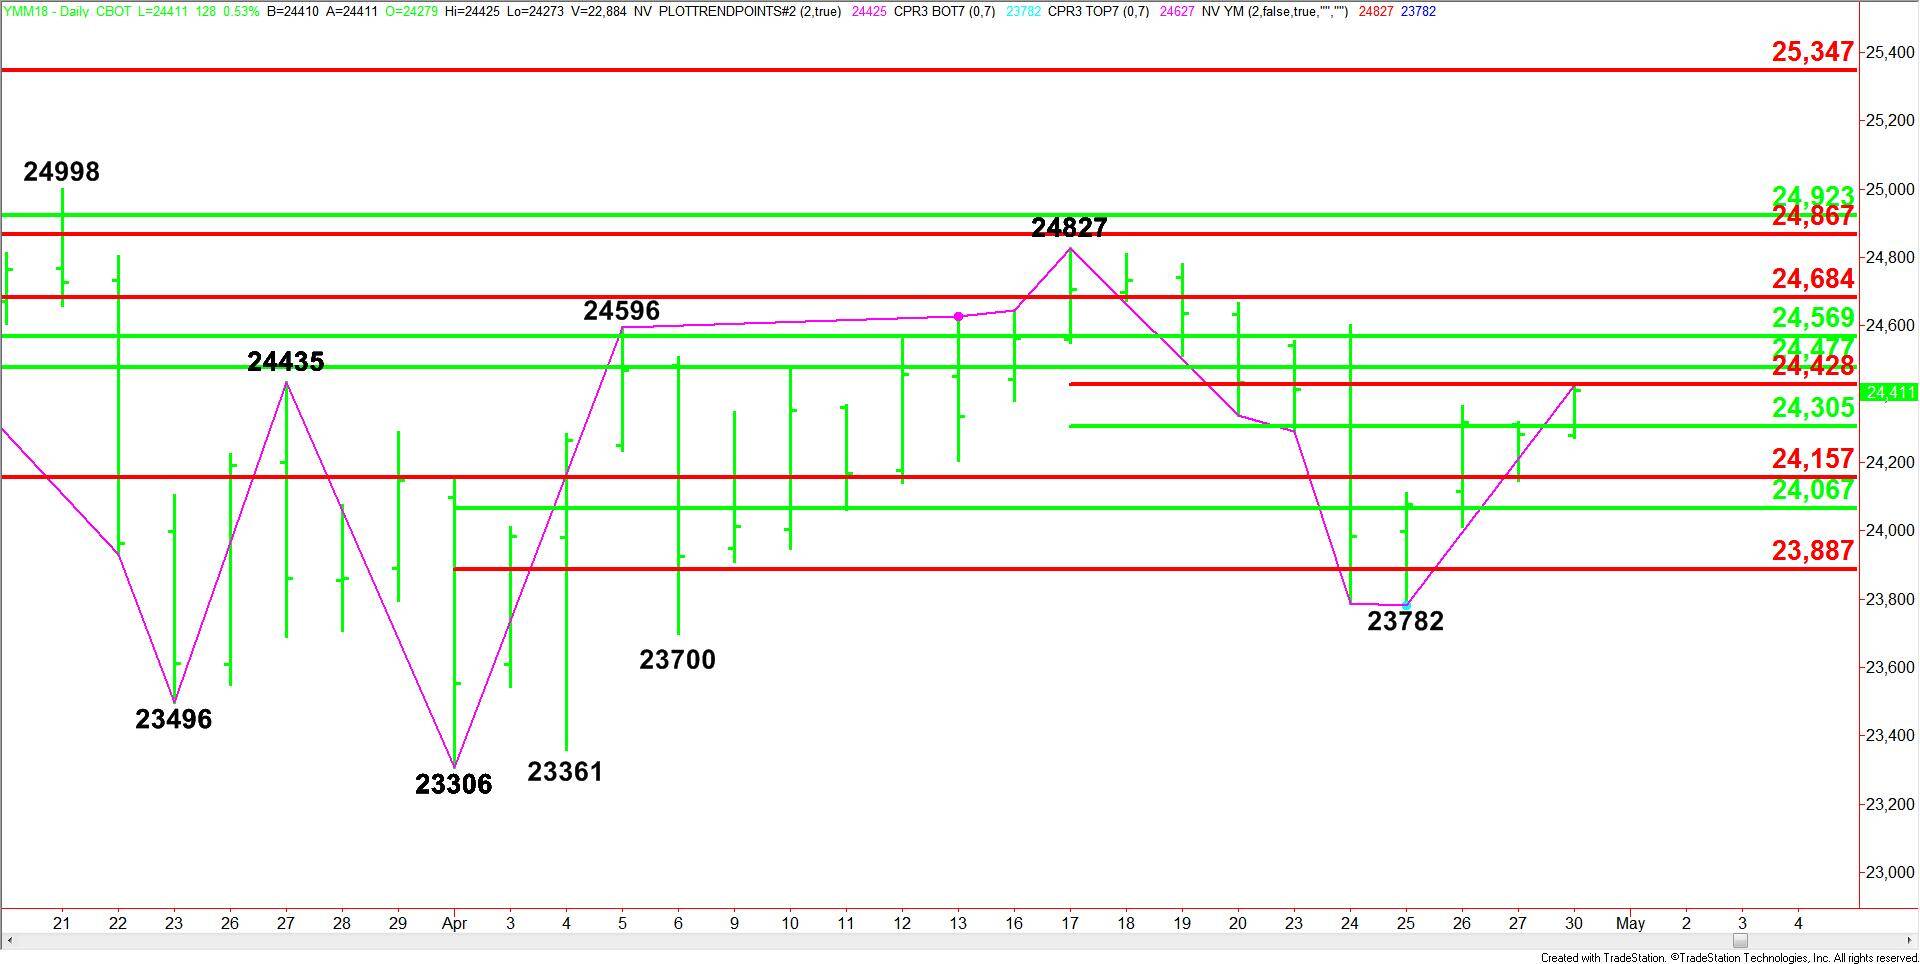
Daily Swing Chart Technical Analysis
The main trend is up according to the daily swing chart. Today’s higher high turned 23782 into a new secondary higher bottom. This suggests the buying is getting stronger.
A trade through 24827 will signal a resumption of the uptrend. A move through 23782 will change the main trend to down.
The short-term range is 24827 to 23782. Its retracement zone at 24305 to 24428 is currently being tested. This zone is controlling the short-term direction of the Dow. Trader reaction to this zone will tell us if the bulls or the bears are in control.
Daily Swing Chart Technical Forecast
Based on the early price action, I see a strong upside bias developing on a sustained move over 24428 and a strong downside bias beginning on a sustained move under 24305.
A move over 24428 will indicate the presence of buyers, but expect to see a labored rally. In other words, a slow grind. This is because nearly three months of range bound trading has created numerous retracement levels that will slow down the buying.
After overcoming 24428, potential resistance levels are layered at 24477, 24569, and 24684.
We could see a surge over 24684, but momentum will slow at 24827, 24867 then 24923. The latter is the true trigger point for an acceleration to the upside.
The downside is a little more wide open. A sustained move under 24305 will indicate the presence of sellers. This could trigger a break into 24157, followed closely by 24067. Taking out this level could lead to a break into 23887, followed by 23782.
The main bottom at 23782 is the trigger point for an acceleration to the downside.