



March E-mini Dow Jones Industrial Average futures are trying to mount a comeback after a steep sell-off earlier in the session. The price action is being fueled by concerns over rising global interest rates and inflation.
UnitedHealth is the biggest loser in the Dow. The market is also on track to post its biggest two-day decline since September 2016.
Daily Technical Analysis
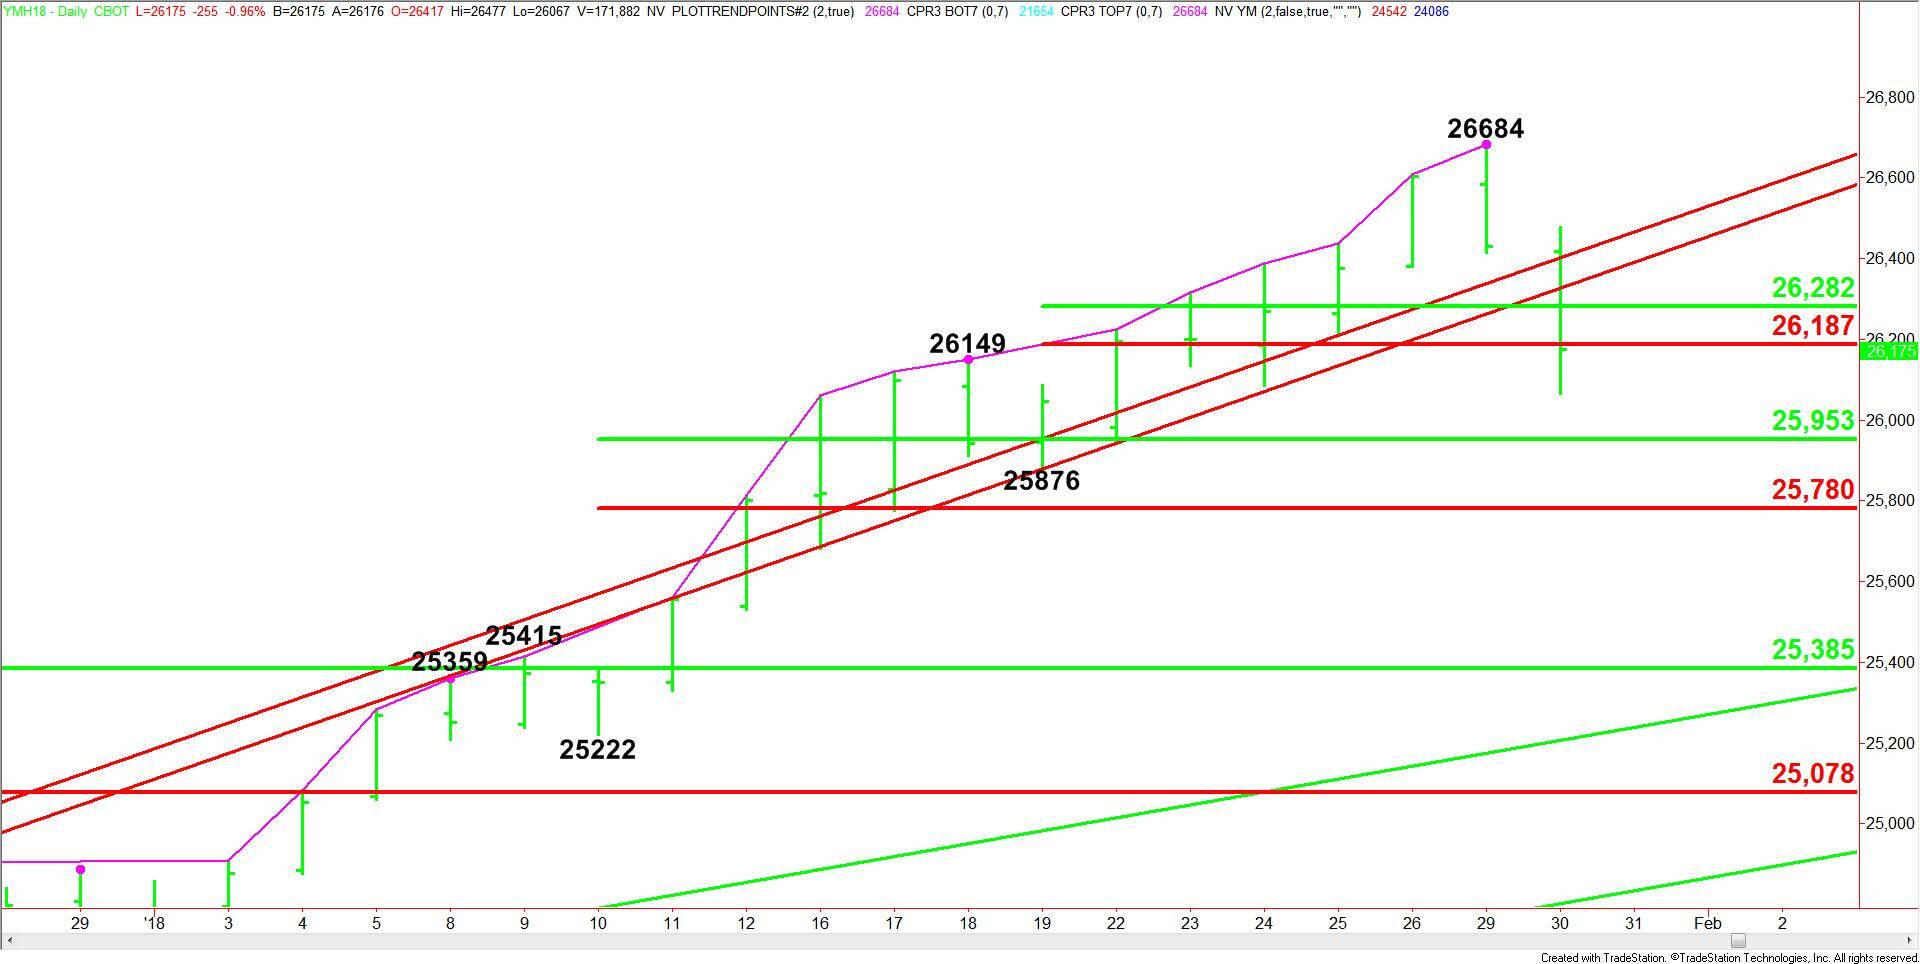
The main trend is up according to the daily swing chart. However, yesterday’s closing price reversal top and today’s subsequent confirmation of the chart pattern, indicates a shift in momentum to down. This could lead to a 2 to 3 break or a 50% to 61.8% correction of the last major rally.
The first minor range is 25876 to 26684. Its retracement zone at 26282 to 26187 was tested earlier today. The market is currently straddling this zone.
The second minor range is 25222 to 26684. Its retracement zone at 25953 to 25780 is the next downside target. Since the main trend is up, buyers may come in on a test of this area.
Daily Technical Forecast
Based on the current price action, the direction of the Dow the rest of the session is likely to be determined by trader reaction to the Fibonacci level at 26187 and the 50% level at 26282.
A sustained move under 26187 will signal the presence of sellers. If this generates enough downside pressure, we could see a test of 25953, followed by 25780.
A sustained move over 26282 will indicate the return of buyers. This could drive the Dow into a pair of uptrending Gann angles at 26326 and 26400. The rally will pick up strength on a sustained move over 26400.