



June E-mini Dow Jones Industrial Average futures are called higher based on the pre-market trade. The market is up six sessions from its most recent swing bottom, but the rally has been labored as buyers claw through a series of retracement levels.
Daily Swing Chart Technical Analysis
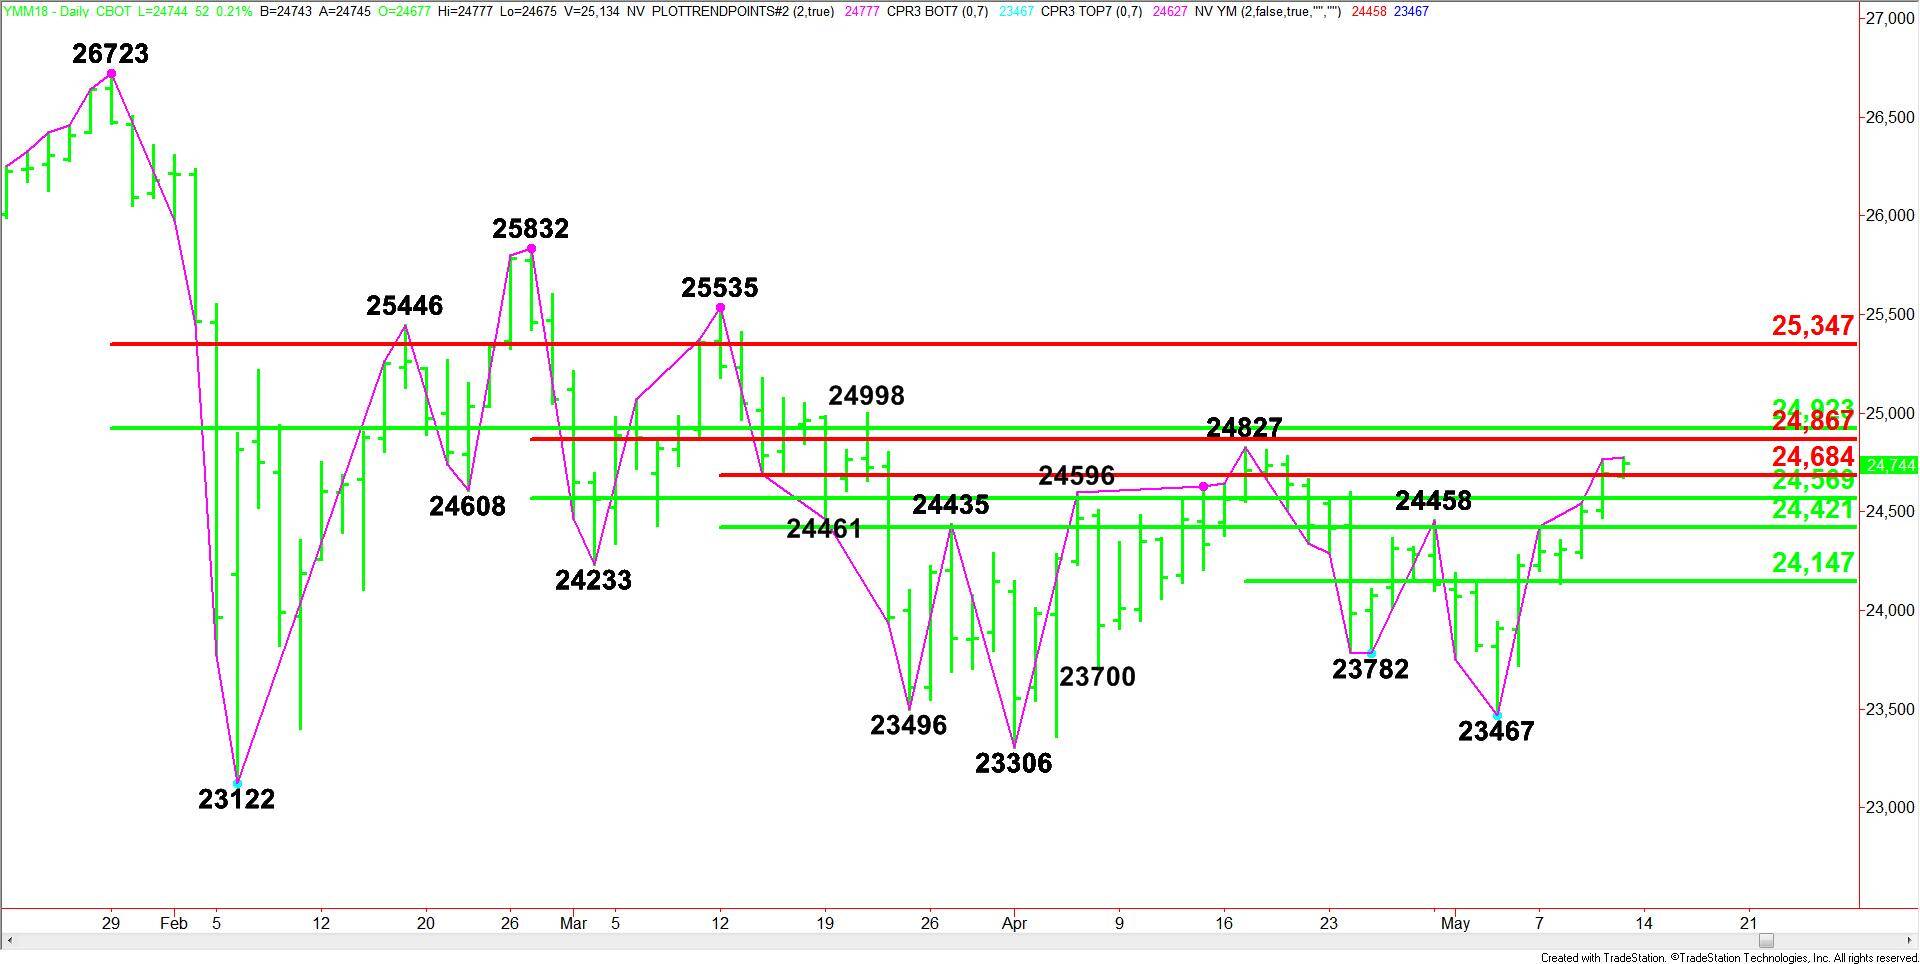
The main trend is up according to the daily swing chart. The trend turned up earlier in the week when buyers took out 24458. It is currently in a position to challenge the next swing top at 24827.
From the top down, the main range is 26723 to 23122. Its retracement zone at 24923 to 25347 is the primary upside target.
The next range is 25832 to 23306. Its retracement zone is 24569 to 24867.
Another range is 25535 to 23306. Its retracement zone is 24421 to 24684.
The short-term range is 24827 to 23467. Its 50% level or pivot is 24147.
Daily Swing Chart Technical Forecast
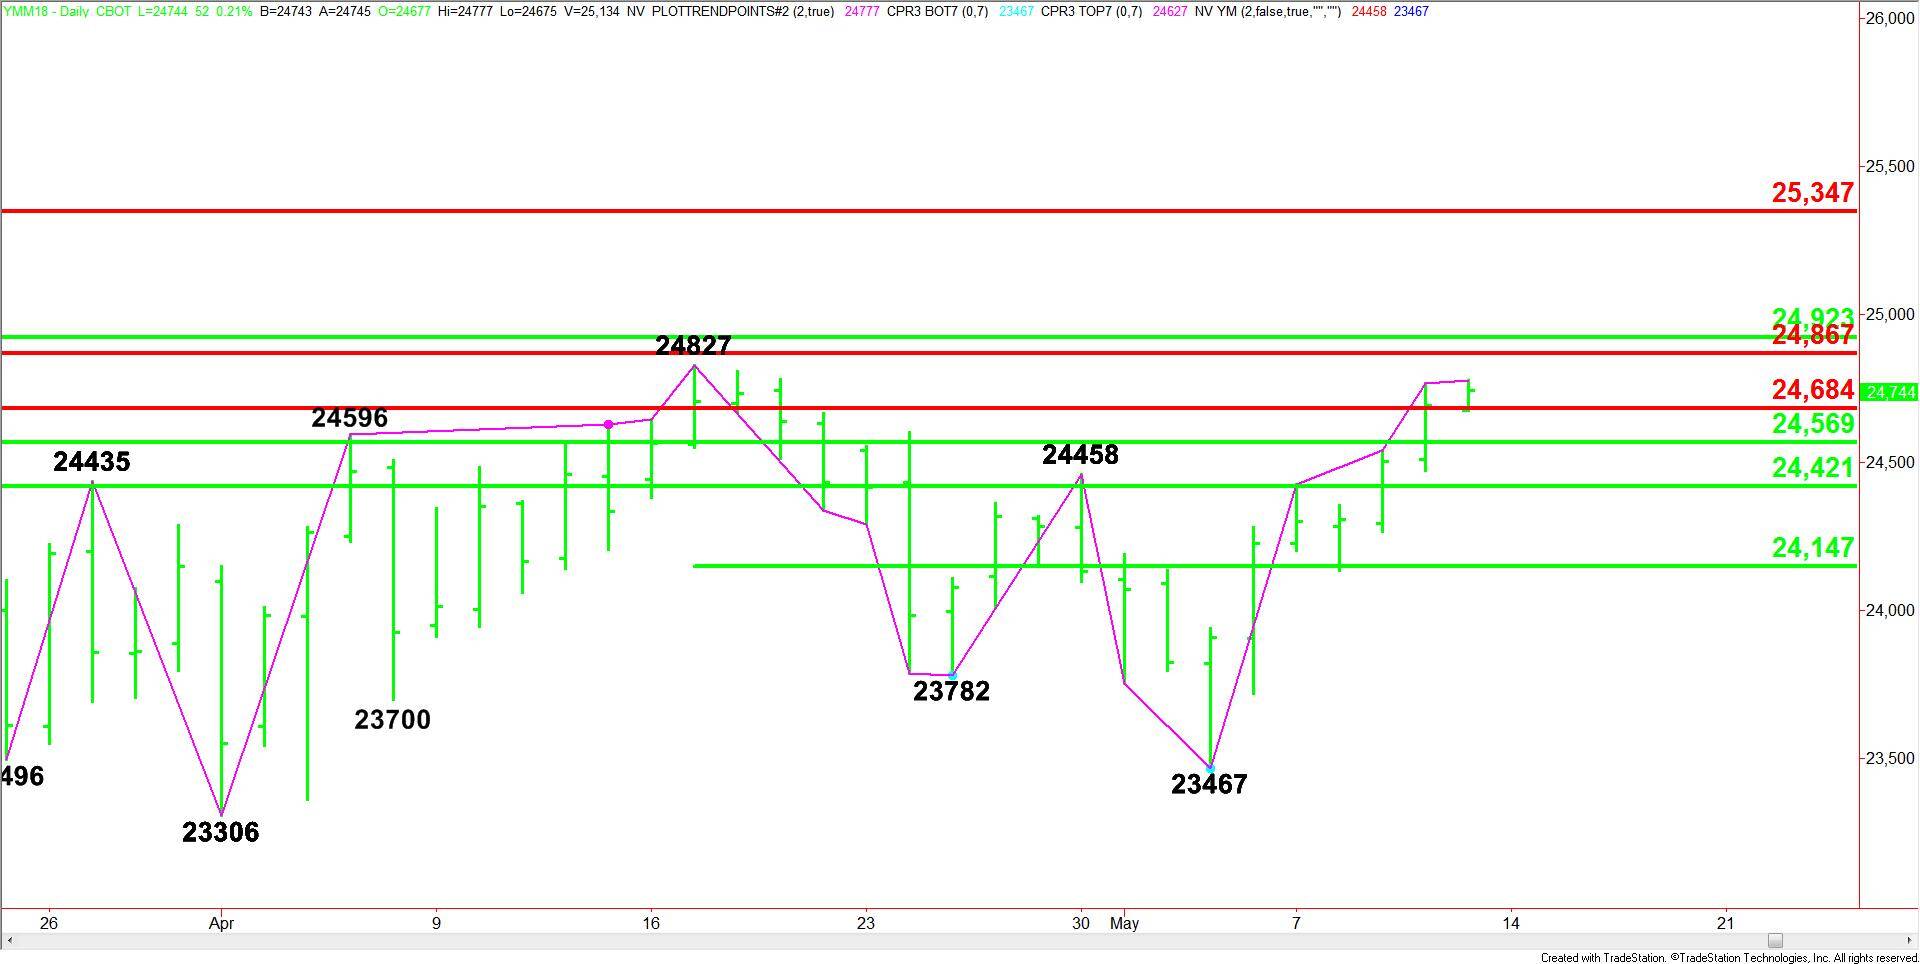
Based on the early price action, the direction of the Dow today is likely to be determined by trader reaction to the Fib level at 24684.
A sustained move over 24684 will indicate the presence of buyers. If this move attracts enough buyers, we could see a drive into potential resistance levels at 24827, 24867 and 24923.
The main 50% level is a possible trigger point for an acceleration to the upside with the main Fib level at 25347 the next likely target.
A sustained move under 24684 will signal the presence of sellers. This could lead to a labored break into 24569 and 24421.
The 50% level at 24421 is the trigger point for a possible acceleration into the next 50% level at 24147.