



June E-mini Dow Jones Industrial Average futures are trading marginally higher shortly before the cash market opening. The Dow is getting a little boost from yesterday’s solid earnings report from Apple. Gains are being capped by worries ahead of the Fed’s announcements at 1800 GMT.
Daily Swing Chart Technical Analysis
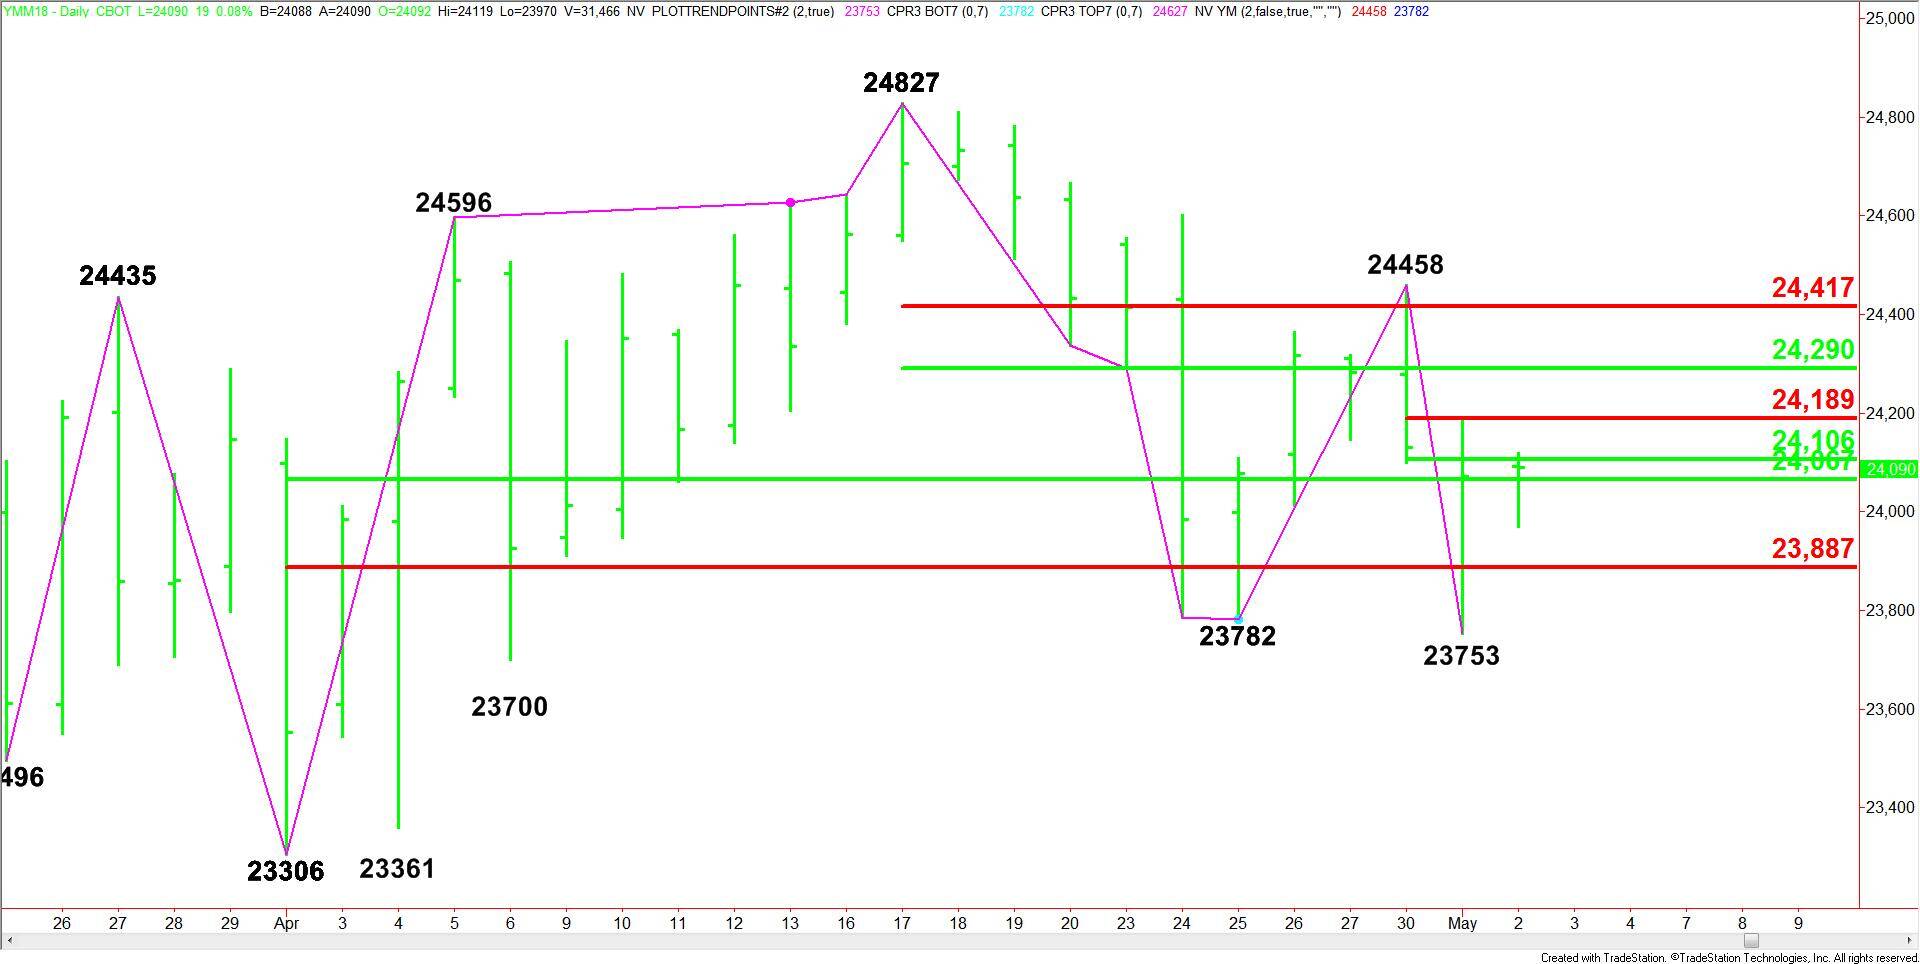
The main trend is down according to the daily swing chart. The trend turned down on Tuesday when sellers drove the Dow through 23782.
A trade through 23753 will signal a resumption of the downtrend. The main trend will change to up on a move through 24458.
Also controlling the price action is a series of retracement levels.
The main range is 23306 to 24827. Its retracement zone is 24067 to 23887. This zone should be considered support.
The intermediate range is 24827 to 23753. Its retracement zone at 24290 to 24417 is resistance.
The short-term retracement zone at 24106 to 24189 is also resistance.
Daily Swing Chart Technical Forecast
Based on the early trade, the direction of the Dow today is likely to be determined by trader reaction to the 50% level at 24067.
A sustained move over 24067 will signal the presence of buyers. This could lead to quick test of the short-term 50% level at 24106 and the short-term Fibonacci level at 24189. Since the trend is down, we could see sellers show up on the first test of this zone.
Overtaking 24189 will indicate the buying is getting stronger with the next targets coming in at 24290, 24417 and 24458. The latter is the trigger point for an acceleration to the upside.
A sustained move under 24067 will indicate the presence of sellers. This move could trigger an acceleration to the downside with the next target 23887.
Look for the selling to extend under 23887 with 23753 the next major target. This price is the trigger point for a steep break. The daily chart shows there is plenty of room to the downside under this level with 23306 the next major target.