



June E-mini Dow Jones Industrial Average futures are called lower based on the early trade. Renewed concerns over a possible trade war between the United States and China are weighing on traders’ minds today.
Daily Swing Chart Technical Analysis
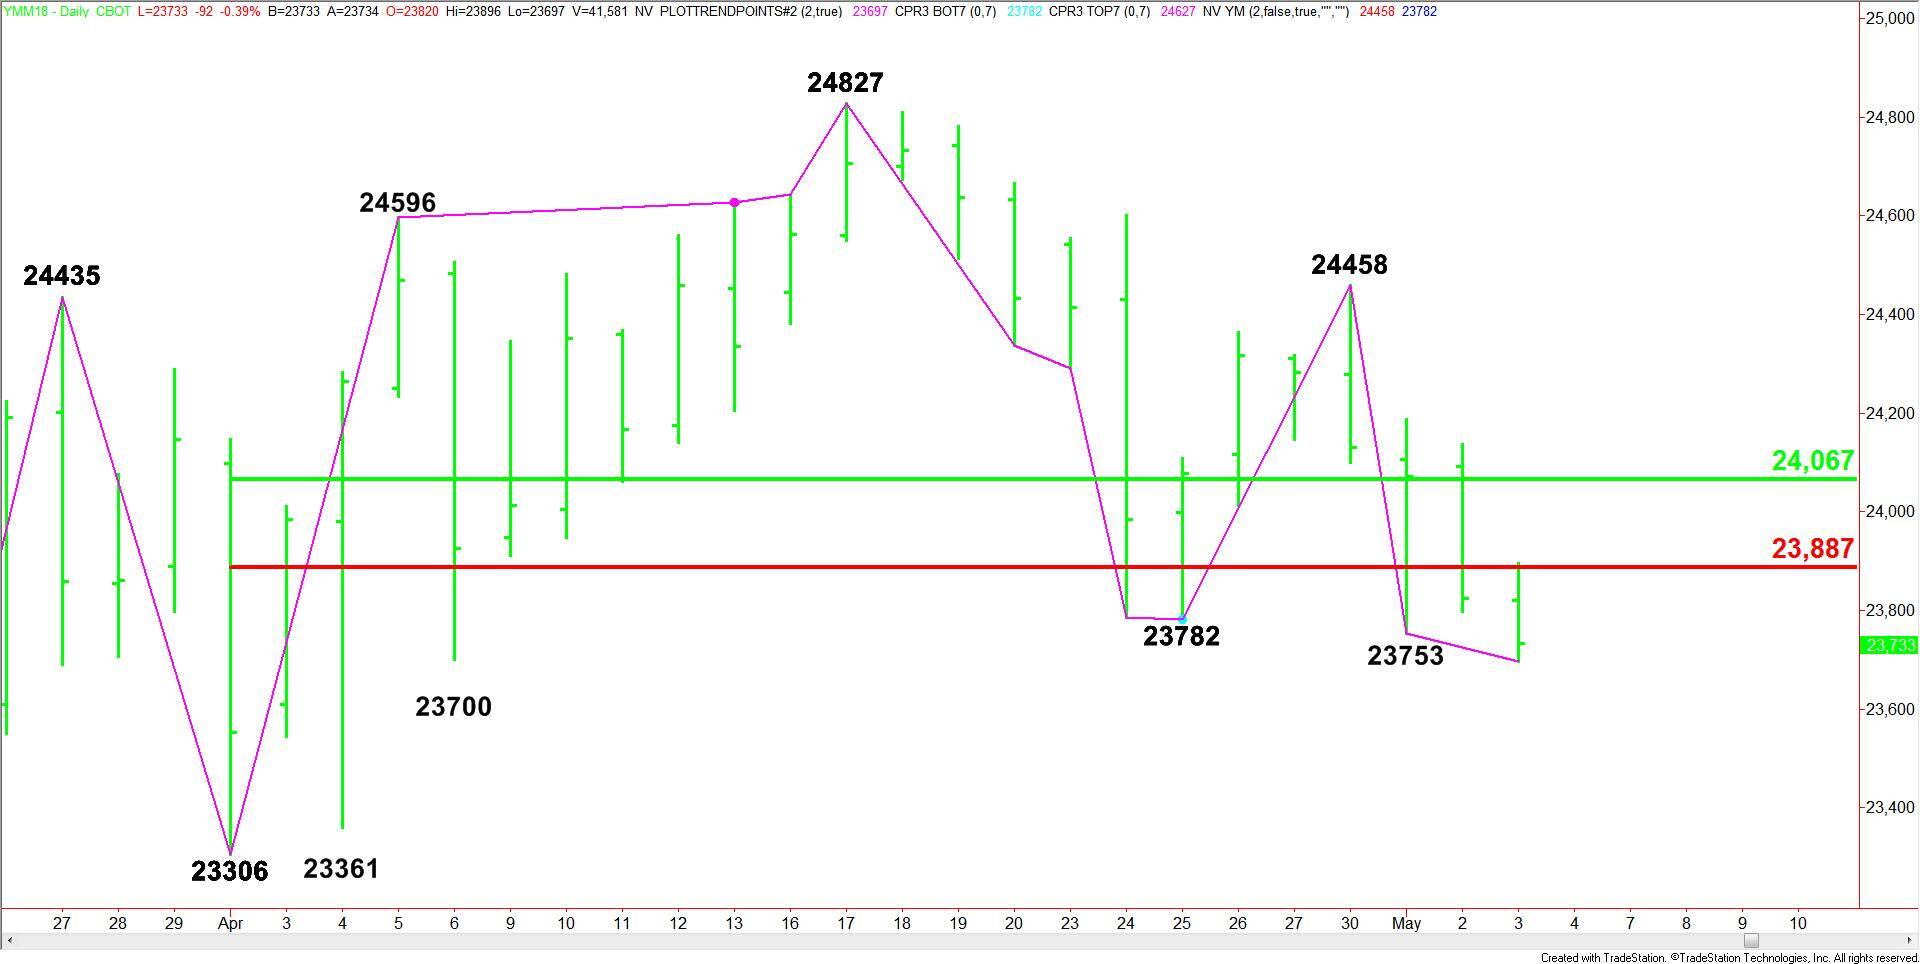
The main trend is down according to the daily swing chart. The trend turned down on Tuesday so today’s move represents a continuation of that move.
The main range is 23306 to 24827. Its retracement zone at 23887 to 24067 is new resistance.
Daily Swing Chart Technical Forecast
Based on the early trade, the direction of the Dow the rest of the session is likely to be determined by trader reaction to the previous bottom at 23753.
A sustained move under 23753 will indicate the selling is getting stronger. If this move creates enough downside momentum, the selling could extend into a minor bottom at 23700.
Look for the selling to pick up speed on a sustained move under 23700 with the next likely targets a pair of bottoms at 23361 and 23306.
Retaking 23753 and sustaining the move will signal the presence of buyers. If this attracts enough buyers, we could see a short-covering rally into the Fibonacci level at 23887. Overcoming this level will mean the buying is getting stronger with the 50% level at 24067 the next likely upside target.
Overcoming 24067 will shift momentum back to the upside.
Essentially, a sustained move under the former bottom at 23753 will indicate that the break is being fueled by actual selling rather than just sell stops.