
Advertisement
Advertisement
E-mini Dow Jones Industrial Average (YM) Futures Analysis – November 3, 2015 Forecast
By:
December E-mini Dow Jones Industrial Average futures closed higher on Monday, reversing early weakness. The inability to take out Friday’s closing price
December E-mini Dow Jones Industrial Average futures closed higher on Monday, reversing early weakness. The inability to take out Friday’s closing price reversal top, however, has left it intact and has created a potentially bearish divergence with the other major indices.
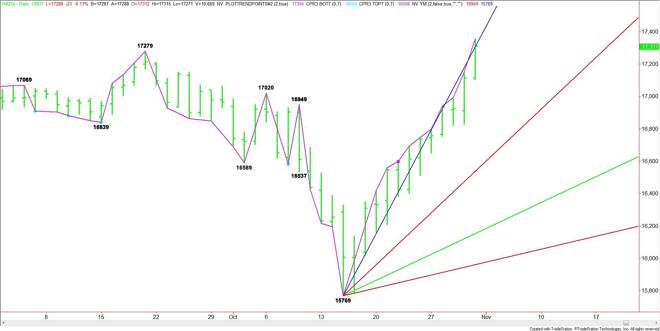
The main trend is up according to the daily swing chart. However, momentum may be getting ready to shift to the downside if the potentially bearish closing price reversal top at 17769 is not violated.
Based on yesterday’s close at 17735, the nearest upside target is Friday’s high at 17769. A trade through this level will negate the closing price reversal top. This could trigger a breakout to the upside.
If the upside breakout is triggered by buy stops then the rally may not last. If investors come in on the breakout and are willing to buy strength then look for an acceleration to the upside.
A sustained move under the steep uptrending angle at 17689 will signal the presence of sellers. This could trigger the start of an acceleration to the downside.
The daily chart opens up to the downside under 17689 with the next major target a long-term, uptrending angle at 17399.
If 16793 to 17769 becomes a new main range then its retracement zone at 17281 to 17166 becomes the primary downside target.
Watch the price action and read the order flow at 17689 today. Trader reaction to this angle will tell us whether the bulls or the bears are still in control.
Also watch the price action and order flow at 17769. Taking it out with conviction and sustaining the move will be a bullish sign. However, taking it out then breaking back below it will indicate that the selling is greater than the buying at current price levels.
About the Author
James Hyerczykauthor
James Hyerczyk is a U.S. based seasoned technical analyst and educator with over 40 years of experience in market analysis and trading, specializing in chart patterns and price movement. He is the author of two books on technical analysis and has a background in both futures and stock markets.


Advertisement