



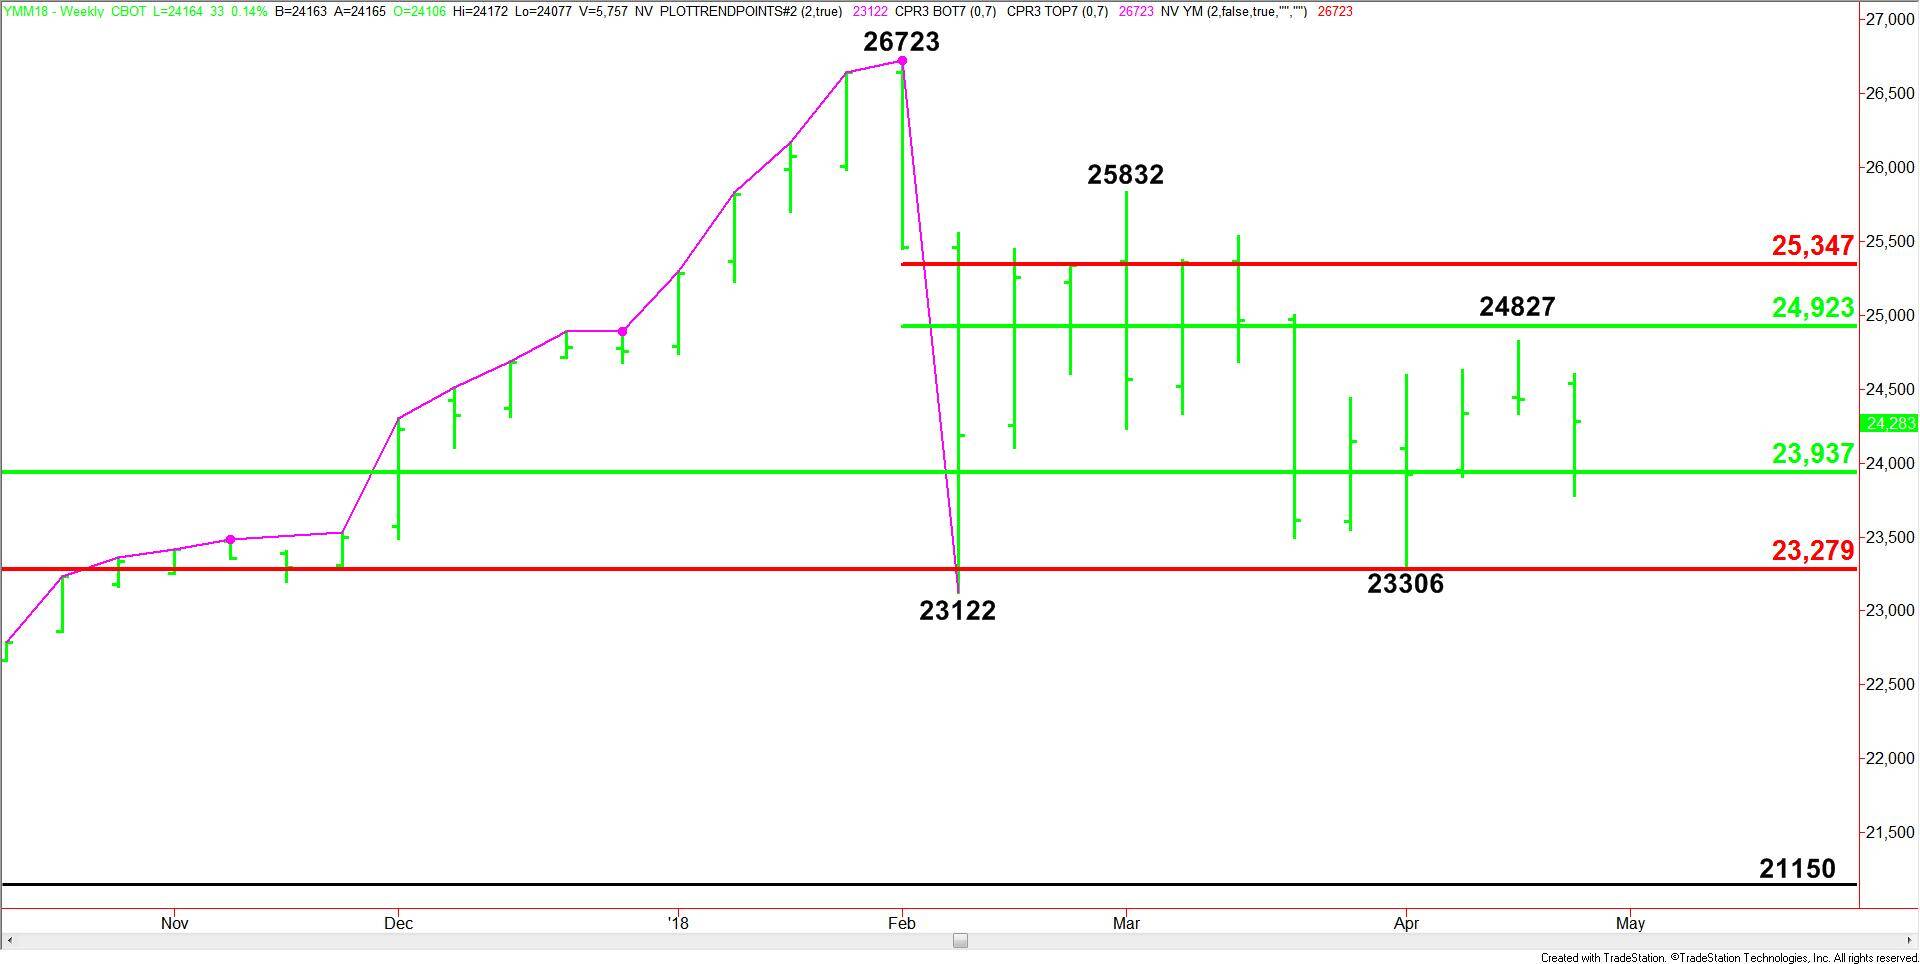
June E-mini Dow Jones Industrial Average futures finished lower last week while continuing to trade inside a nearly three-month. The chart pattern suggests investor indecision and impending volatility.
Weekly Swing Chart Technical Analysis
The main trend is up according to the weekly swing chart, however, the momentum is drifting sideways to lower.
The minor trend is also down. A move through 24827 will change the minor trend to up. This move will shift momentum to the upside.
The main retracement zone which is providing the support is 23937 to 23279. This zone essentially provided support at 23122 and 23306.
The short-term range is 26723 to 23122. Its retracement zone at 24923 to 25347 is providing resistance.
Weekly Swing Chart Technical Forecast
Based on last week’s price action, the direction of the June E-mini Dow Jones Industrial Average is likely to be determined by trader reaction to the main 50% level at 23937.
Holding above 23937 will indicate the presence of buyers. If this move creates enough upside momentum, we could see a drive through the minor top at 24827. This will shift momentum to the upside.
The next upside barrier is 24923. We could see a technical bounce on the first test of this level. Overtaking it will likely send the market into the Fibonacci level at 25347. Once again, look for a technical bounce on the first test of this level.
Overtaking 25347 will indicate the buying is getting stronger. This could trigger the start of an acceleration to the upside with the next target 25832, followed by 26723.
Breaking through and sustaining the move under 23937 will signal the presence of sellers. This could create the downside momentum needed to challenge the major Fib level at 23279. Look for a technical bounce on the first test of this level.
A failure to hold 23279 will indicate the selling is getting stronger. Taking out 23122 could trigger an acceleration to the downside with 21150 the eventual downside target.