



March E-mini Dow Jones Industrial Average futures are trading lower, following the lead in Asia and Europe. Caution over U.S.-China trade relations is encouraging investors to pare positions as the two economic powerhouses continue to try to hammer out a trade deal in a timely manner. Investors are primarily concerned about the lack of details coming out of the negotiations.
At 10:47 GMT, March E-mini Dow Jones Industrial Average futures are trading 26035, down 64 or -0.25%.
Traders are also positioning themselves ahead of the start of three days of testimony before Congress by Fed Chair Jerome Powell. Investors will be looking for clues on future rate hikes and other monetary policy decisions.
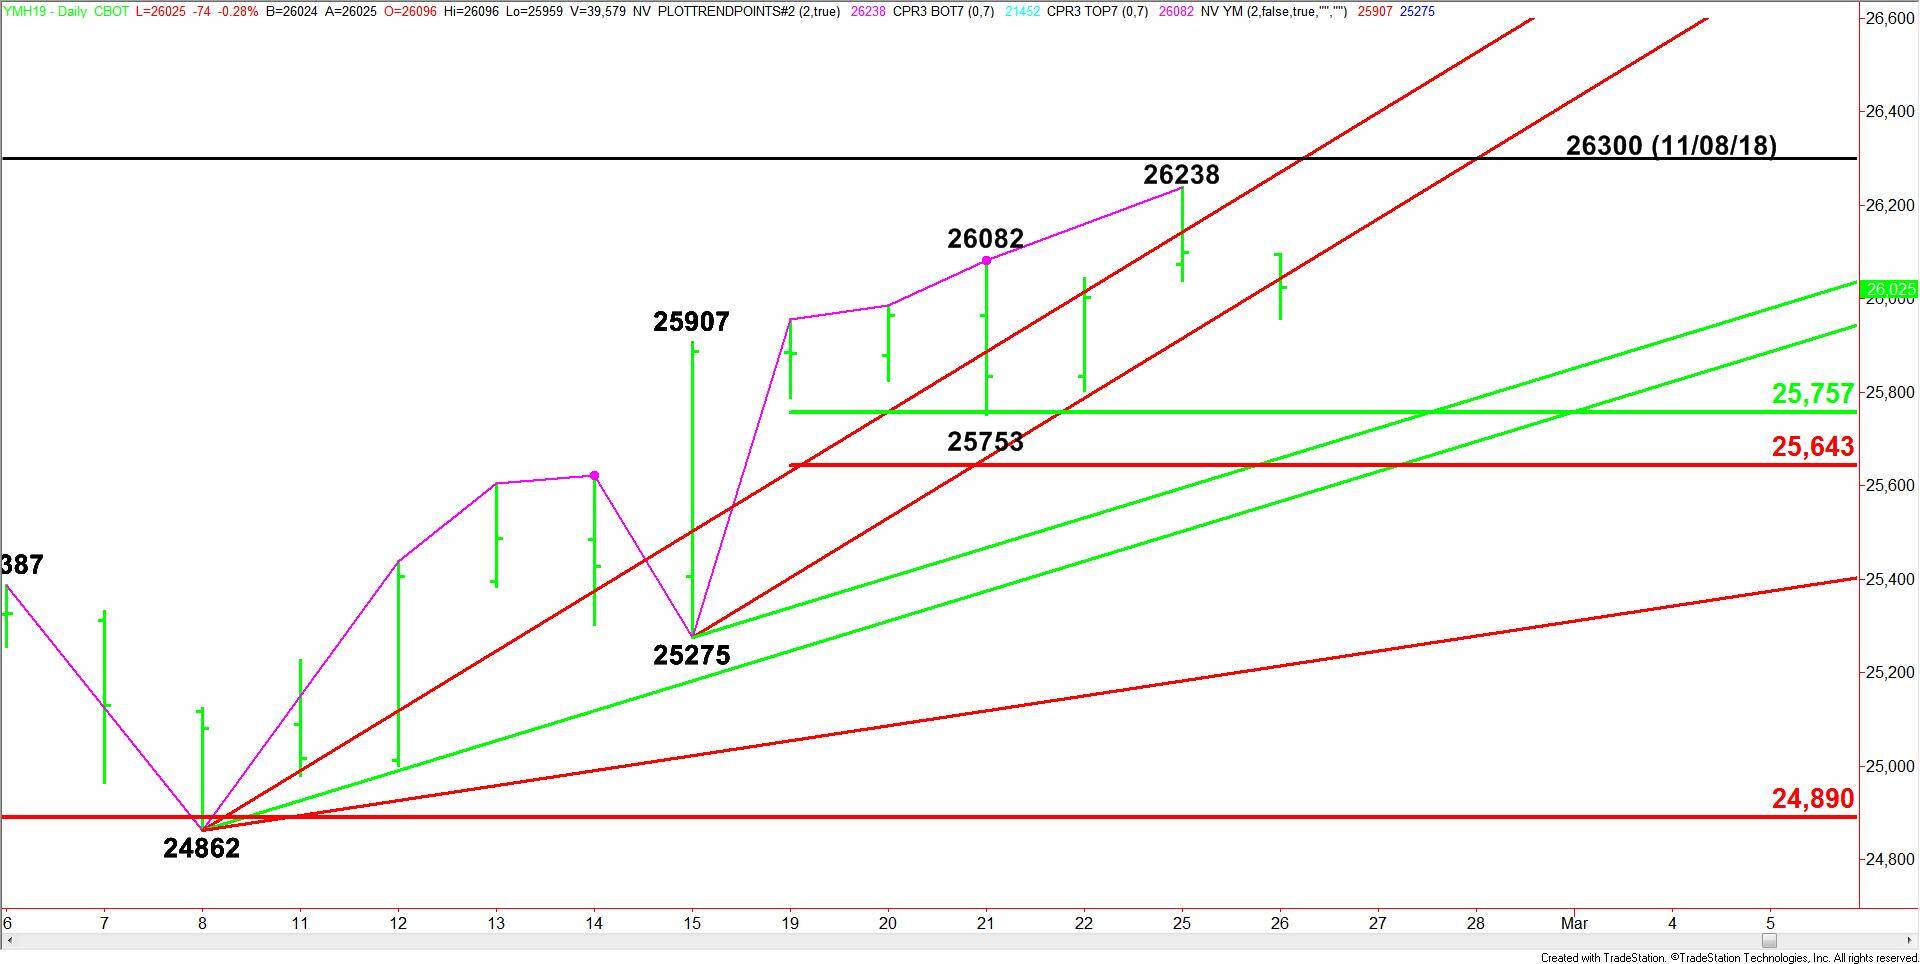
Daily Technical Analysis
The main trend is up according to the daily swing chart. A trade through 26238 will signal a resumption of the uptrend. Monday’s rally stopped short of the November 8 main top at 26300.
The minor trend is also up. A new minor top has formed at 26238. A trade through 25753 will change the minor trend to down. This will also shift momentum to the downside.
The short-term range is 25275 to 26238. Its retracement zone at 25757 to 25643 is the primary downside target. Since the main trend is up and this zone represents value, buyers are likely to come in on a test of this area.
Daily Technical Forecast
Based on the early price action, the direction of the March E-mini Dow Jones Industrial Average is likely to be determined by trader reaction to the uptrending Gann angle at 26043.
Bullish Scenario
Overtaking and sustaining a rally over 26043 will indicate the presence of buyers. If this move creates enough upside momentum then look for a potential rally into yesterday’s high at 26238 and the uptrending Gann angle at 26270.
Overtaking 26270 will put the Dow in a bullish position with the November 8 main top at 26300 the next target. This is the trigger point for a potential acceleration to the upside.
Bearish Scenario
A sustained move under 26043 will signal the presence of sellers. The daily chart is wide open under this level with 25757 the next major target. This is followed by a support cluster at 25659 to 25643.