



June E-mini NASDAQ-100 Index futures are called higher based on the pre-market trade. Yesterday’s closing price reversal bottom was confirmed earlier in the session, shifting momentum to the upside.
Daily Swing Chart Technical Analysis
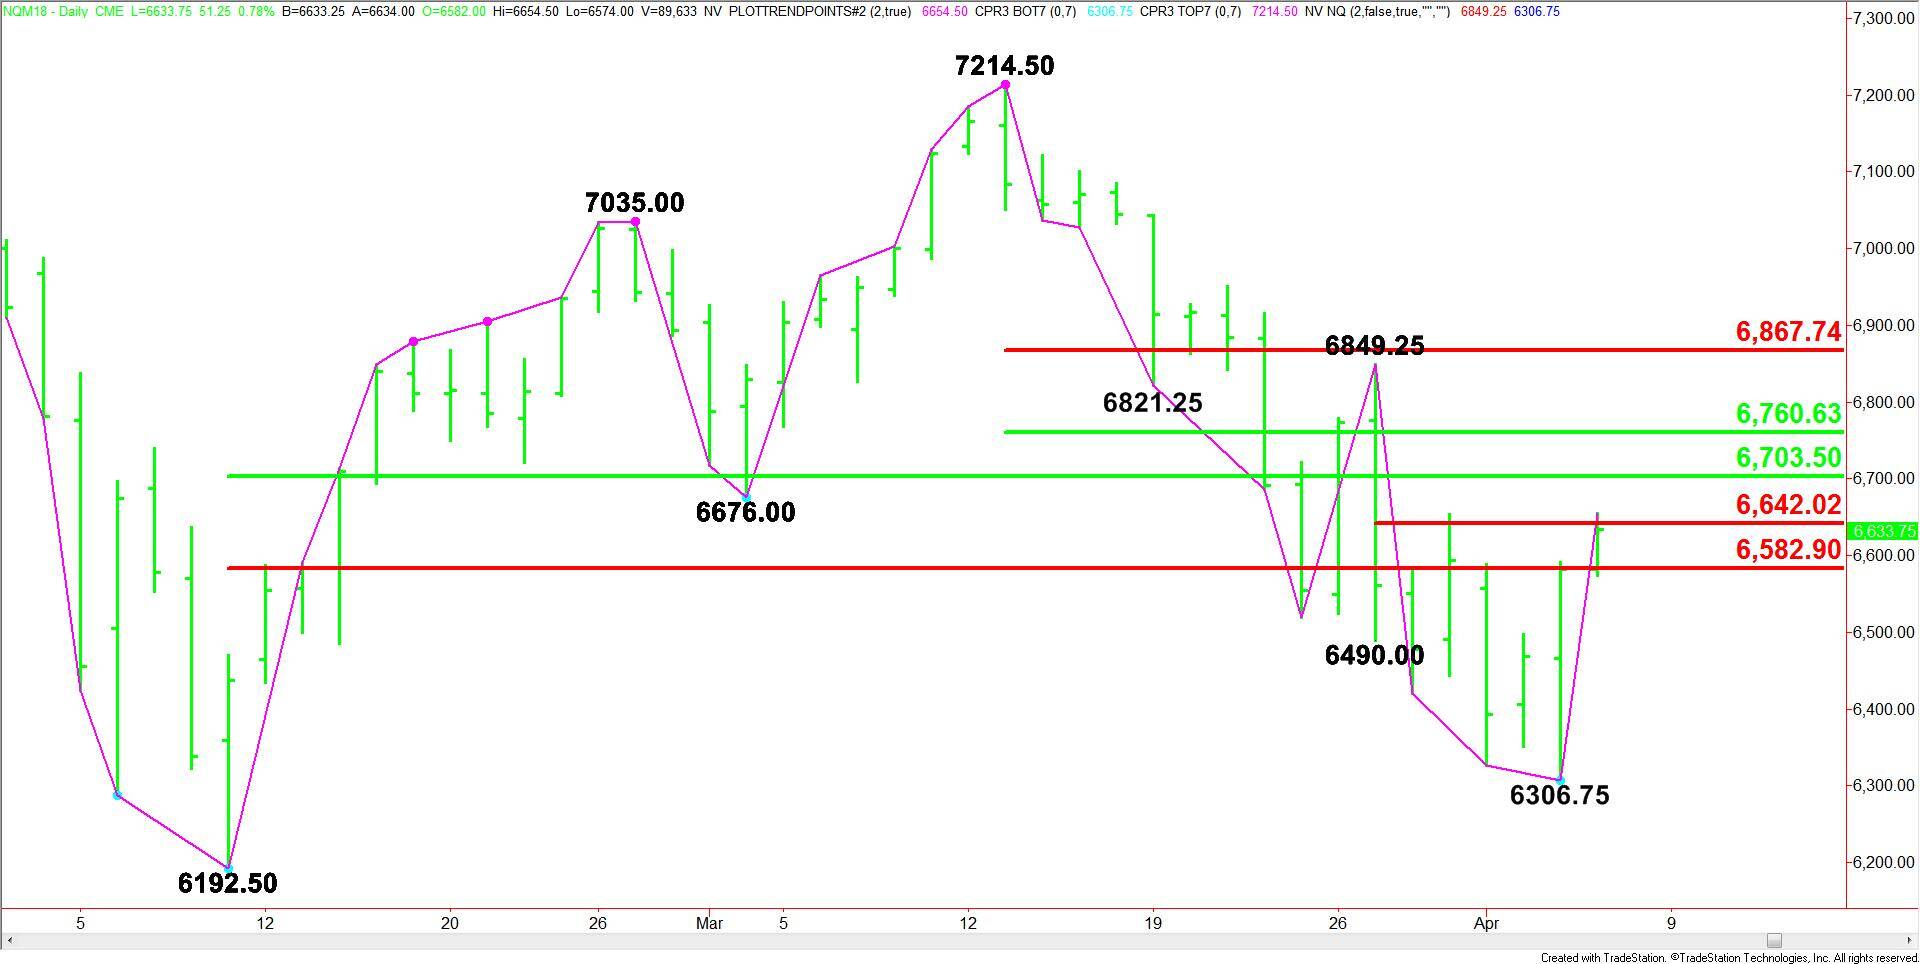
The main trend is down according to the daily swing chart. A trade through 6306.75 will negate the closing price reversal bottom and signal a resumption of the downtrend.
The main trend will change to up on a move through 6849.25. However, in order to get there, buyers have to take out a series of retracement levels that could slow down the upside momentum.
The main range is 6192.50 to 7214.50. Its retracement zone is 6703.50 to 6583.00.
The short-term range is 6849.25 to 6306.75. Its retracement zone is 6578.00 to 6642.00.
The intermediate range is 7214.50 to 6306.75. Its retracement zone comes in at 6760.75 to 6867.75. The main top falls inside this zone.
Daily Swing Chart Technical Forecast
Based on the early trade, the direction of the index today is likely to be determined by trader reaction to 6578.00.
A sustained move over 6578.00 will indicate the presence of buyers. Holding above 6583.00 will indicate the buying is getting stronger. This should lead to a test of 6642.00. This is essentially the move we saw earlier today.
The trigger point for an acceleration to the upside is 6642.00. Taking out this price with strong volume should trigger a move into 6703.50. This is followed by 6760.75.
The trigger point for a surge to the upside is 6760.75. Overtaking this level could lead to move to 6849.25 and an eventual change in trend.
A sustained move under 6583.00 will signal the presence of sellers. This could trigger the start of a steep break.