



September E-mini NASDAQ-100 Index futures are trading higher shortly after the cash market opening. Investors showed limited reaction to today’s better-than-expected Preliminary U.S. GDP data, however, the index is being underpinned by a sharp rise in shares of Amazon and Alphabet.
Daily Technical Analysis
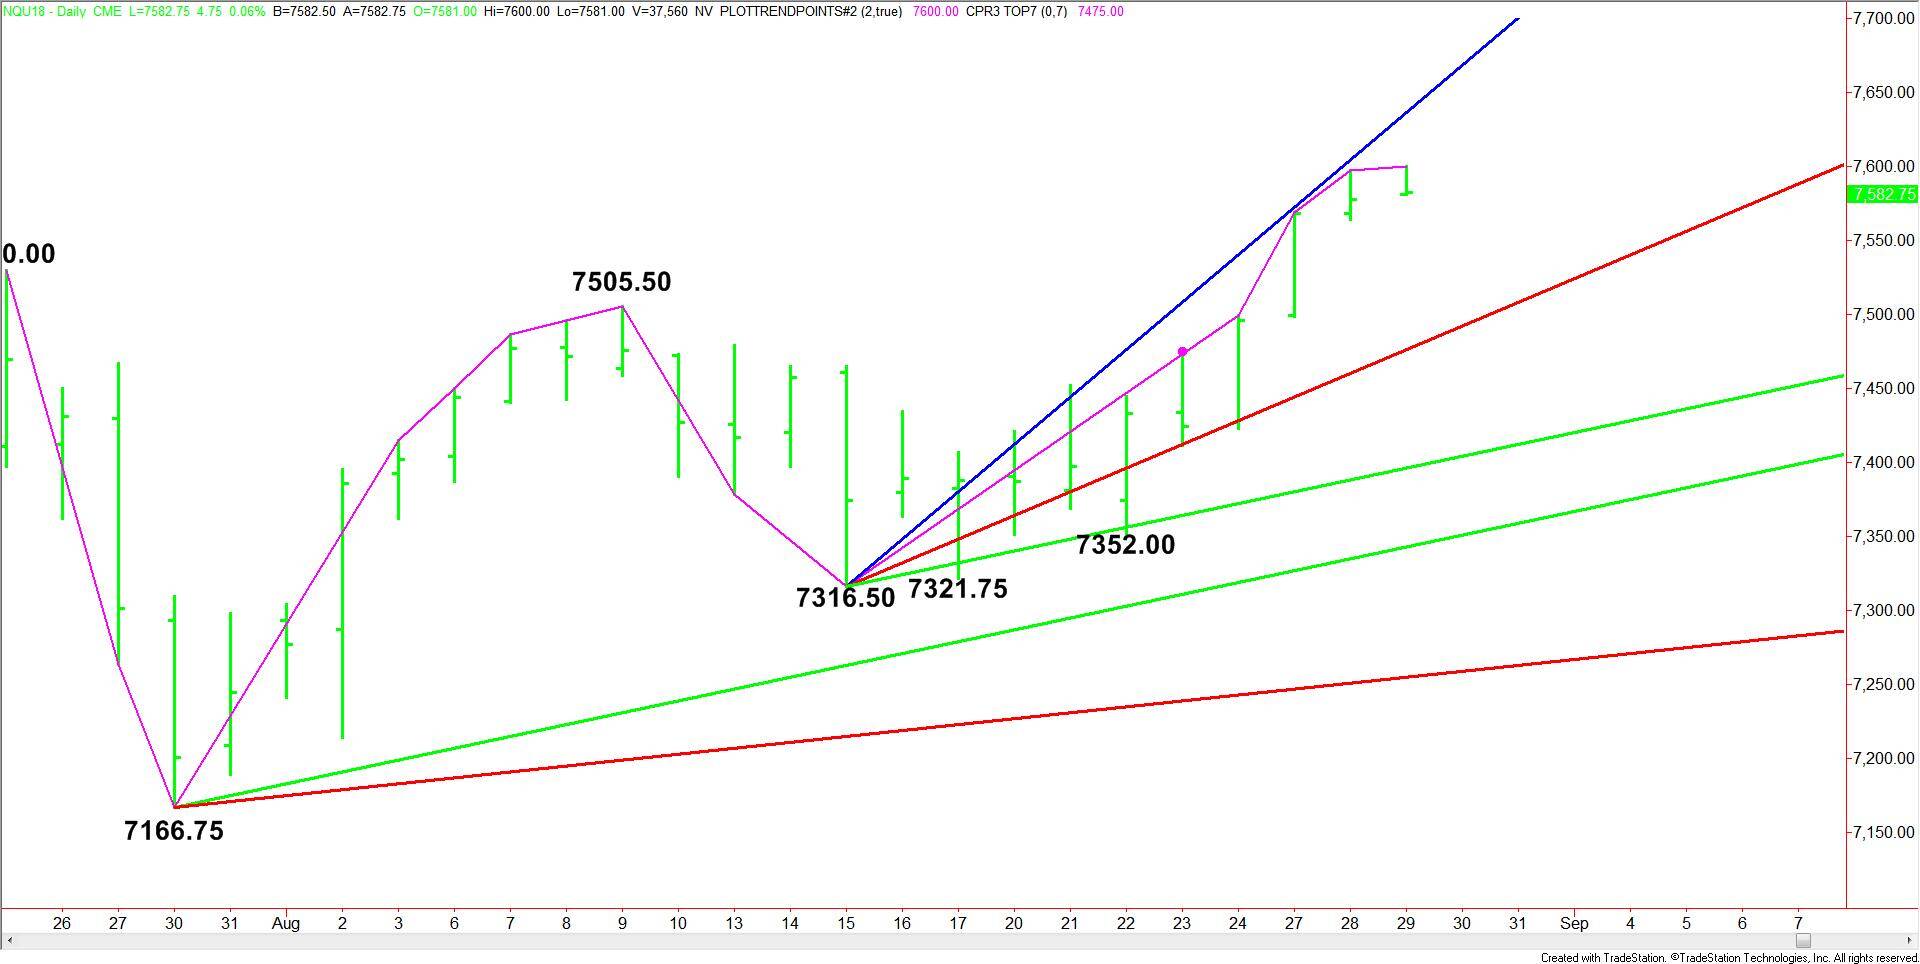
The main trend is up according to the daily swing chart. It was reaffirmed earlier today when buyers took out yesterday’s high. There are targets to the upside, but no identifiable resistance. However, due to the prolonged move up in terms of price and time, the pattern we should be watching for which typically indicates the emergence of selling pressure is the closing price reversal top.
Daily Technical Forecast
Based on the early trade, the direction of the September E-mini NASDAQ-100 Index the rest of the session is likely to be determined by trader reaction to yesterday’s close at 7578.00.
A sustained move over 7578.00 will indicate the presence of buyers. If they can continue to push the index higher, then it may hit the steep uptrending Gann angle at 7636.50.
Crossing to the strong side of the angle at 7636.50 will put the index in an extremely bullish position.
A sustained move under 7578.00 will signal the presence of sellers. This will also put the index in a position to form a potentially bearish closing price reversal top on the daily chart. If formed and confirmed then we could see the start of a 2 to 3 day correction.
After turning lower today, the first target will be yesterday’s low at 7564.25. Taking out this level will form an outside move on the daily chart while making today’s high a new minor top.
The key will be whether the market just drifts lower for the next 2 to 3 days, or breaks sharply in a volatile move. This is because the daily chart indicates there is plenty of room to the downside with the next uptrending Gann angle target coming in at 7476.50 today.
Basically, a sustained move over 7578.00 will indicate the buying may be strong enough to challenge or perhaps overtake a steep uptrending Gann angle at 7636.50.
A sustained move under 7578.00 may be signaling the return of sellers. And if they can generate enough downside momentum then we could see a short-term break into an uptrending Gann angle, currently at 7476.50.