
Advertisement
Advertisement
E-mini NASDAQ-100 Index (NQ) Futures Technical Analysis – August 7, 2015 Forecast
By:
September E-mini NASDAQ-100 Index futures are trading lower shortly before the cash market opening and the release of the latest U.S. Non-Farm Payrolls
September E-mini NASDAQ-100 Index futures are trading lower shortly before the cash market opening and the release of the latest U.S. Non-Farm Payrolls report. Traders expect the report to show the economy added 222K new jobs in July. A substantially higher number should be bearish. A substantially lower number is likely to be bearish. However, don’t guess on the direction. Let the order flow and price action be your guide.
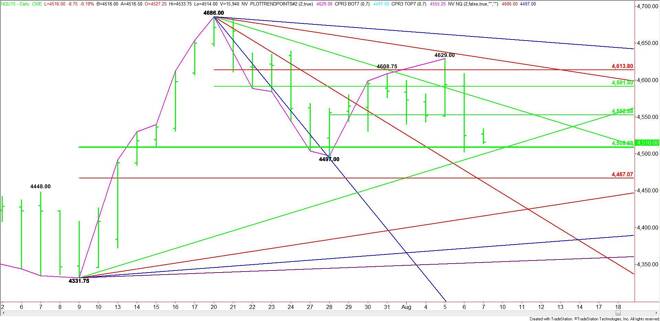
The main trend is up according to the daily swing chart, but the current price at 4516.00 is dangerously close to the last swing bottom at 4497.00. A trade through this level will turn the main trend to down on the daily chart.
The main range is 4331.75 to 4686.00. Its retracement zone is 4508.75 to 4467.00. An uptrending angle at 4499.75 passes through this zone, making it a valid target also. The main bottom at 4497.00 also falls inside the retracement zone.
Clearly, there will be a lot of action inside 4508.75 to 4467.00 so we have to conclude that the direction of the market today will be determined by trader reaction to this zone. This is the most important area on the chart today.
A sustained move under the Fib level at 4467.00 could trigger a steep drop into the next uptrending angle at 4415.75. This is followed by angles at 4373.25 and 4352.75. The latter is the last angle before the 4331.75 main bottom.
Holding the 50% level at 4508.75 will signal the presence of buyers. This could create enough upside momentum to challenge a short-term pivot at 4553.00 and a downtrending angle at 4574.00.
The next targets over 4574.00 are a 50% level at 4591.00, a Fibonacci level at 4613.75 and a downtrending angle at 4630.00. The last angle before the 4686.00 main top comes in at 4658.00.
If you have to rely on one number today then watch the price action and order flow at 4508.75. Trader reaction to this number will determine the direction of the market today.
About the Author
James Hyerczykauthor
James Hyerczyk is a U.S. based seasoned technical analyst and educator with over 40 years of experience in market analysis and trading, specializing in chart patterns and price movement. He is the author of two books on technical analysis and has a background in both futures and stock markets.


Advertisement