


March E-mini NASDAQ-100 Index futures are trading sharply lower early Tuesday. The selling is being fueled by weakness in the major Asian indexes. The catalyst behind the selling pressure is the lack of clarity over U.S.-China trade relations. Investors are looking for more details as to what an eventual deal to end the trade dispute would entail. Furthermore, investors are paring positions ahead of the testimony of Fed Chair Jerome Powell before a Congressional panel. He is expected to address monetary policy, which could create volatility in the market.
At 06:35 GMT, March E-mini NASDAQ-100 Index futures are trading 7086.00, down 39.75 or -0.56%.
Daily Technical Analysis
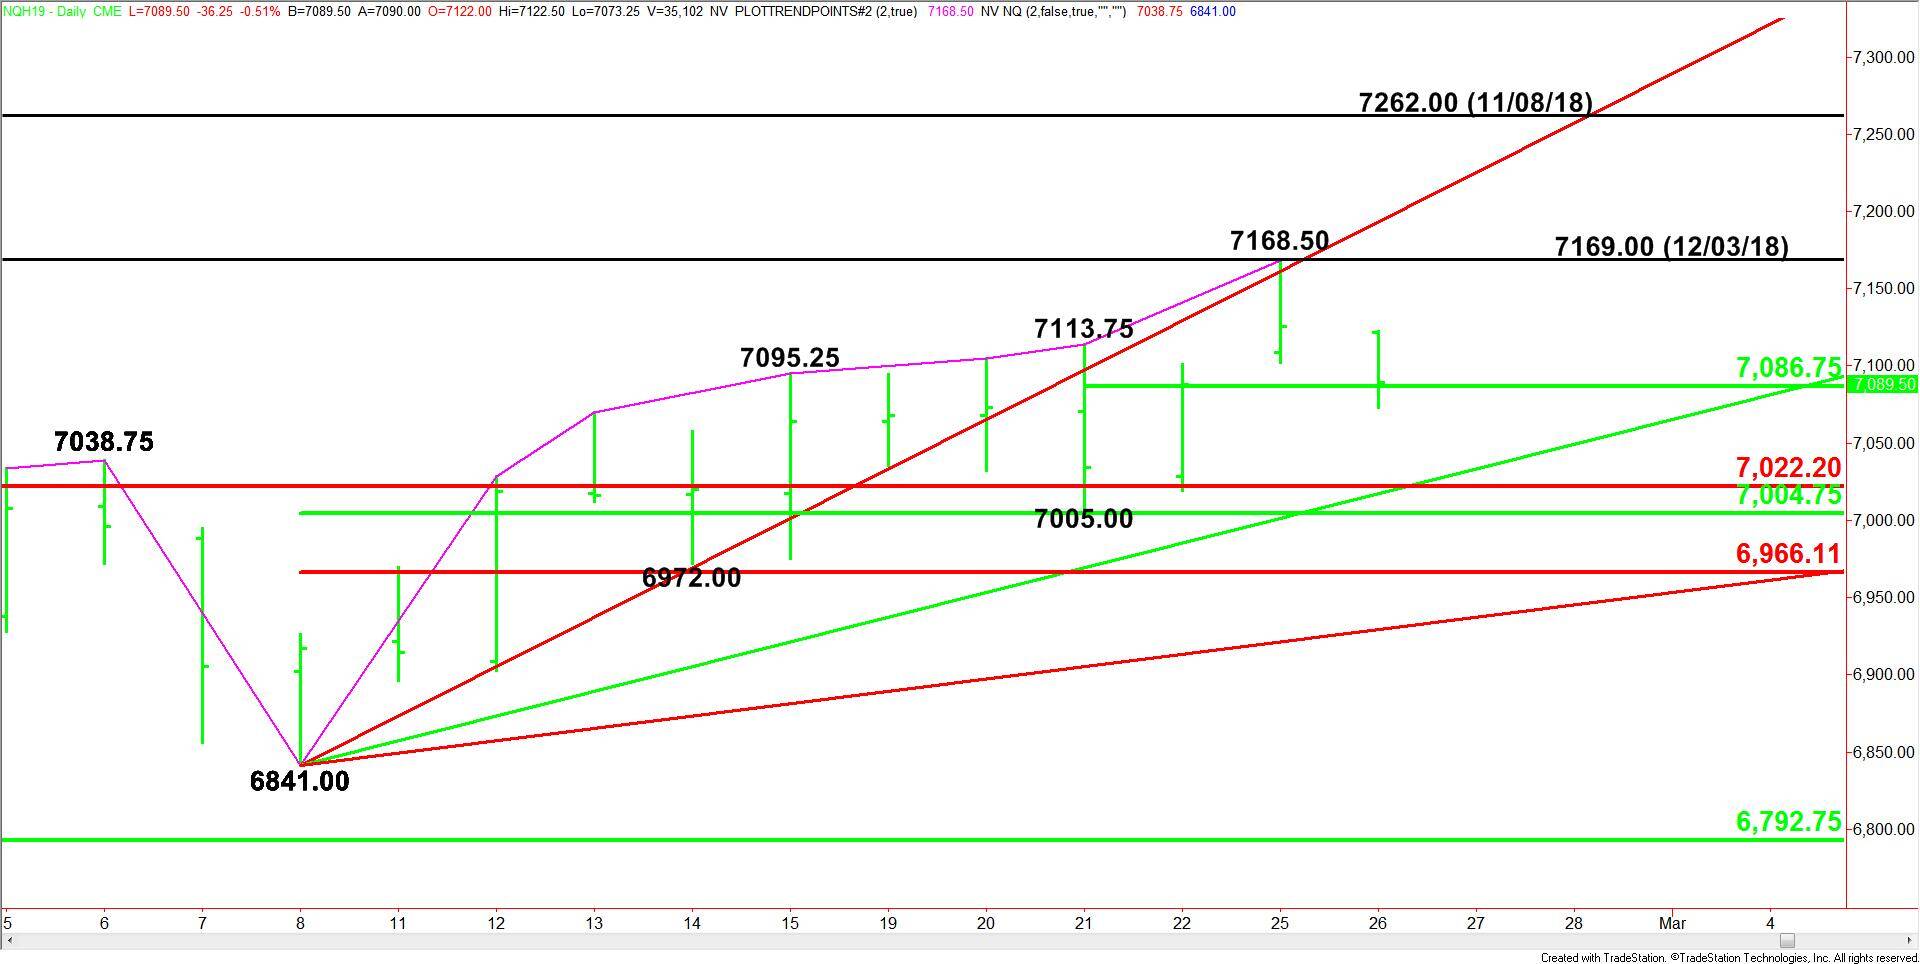
The main trend is up according to the daily swing chart. A trade through 7168.50 will signal a resumption of the uptrend. This should easily generate the upside momentum needed to take out the December 3 main top at 7169.00.
The minor trend is also up. A move through 7005.00 will change the minor trend to down. This will also shift momentum to the downside.
The short-term range is 7005.00 to 7168.50. Its 50% level or pivot at 7086.75 is controlling the price action early in the session.
The major retracement zone is 7022.25 to 6792.75. Trading inside this retracement zone is the main retracement zone at 7004.75 to 6966.00. All of these levels are potential support.
Daily Technical Forecast
Based on the early price action, the direction of the March E-mini NASDAQ-100 Index on Tuesday is likely to be determined by trader reaction to the short-term pivot at 7086.75.
Bullish Scenario
A sustained move over 7086.75 will indicate the presence of buyers. If this creates enough upside momentum then look for buyers to make a run at yesterday’s high at 7168.50 and the main top at 7169.00. Overtaking 7169.00 could trigger a rally into an uptrending Gann angle at 7193.00. Crossing to the strong side of this angle will indicate the buying is getting stronger with the next target the November 8 main top at 7262.00.
Bearish Scenario
A sustained move under 7086.75 will signal the presence of sellers. This could trigger an acceleration to the downside with the next targets a support cluster formed by a Fibonacci level at 7022.25 and an uptrending Gann angle at 7017.00. Since the main trend is up, look for buyers to come in on the initial test of 7017.00 to 7022.25.
The next support cluster is 7005.00 to 7004.75. Look for buyers on a test of this area also.