



March E-mini NASDAQ-100 Index futures are trading higher at 1042 GMT shortly before the cash market opening, but don’t hold your breath. The index has been swinging in both directions so it’s still a guess as to how it’s going to open.
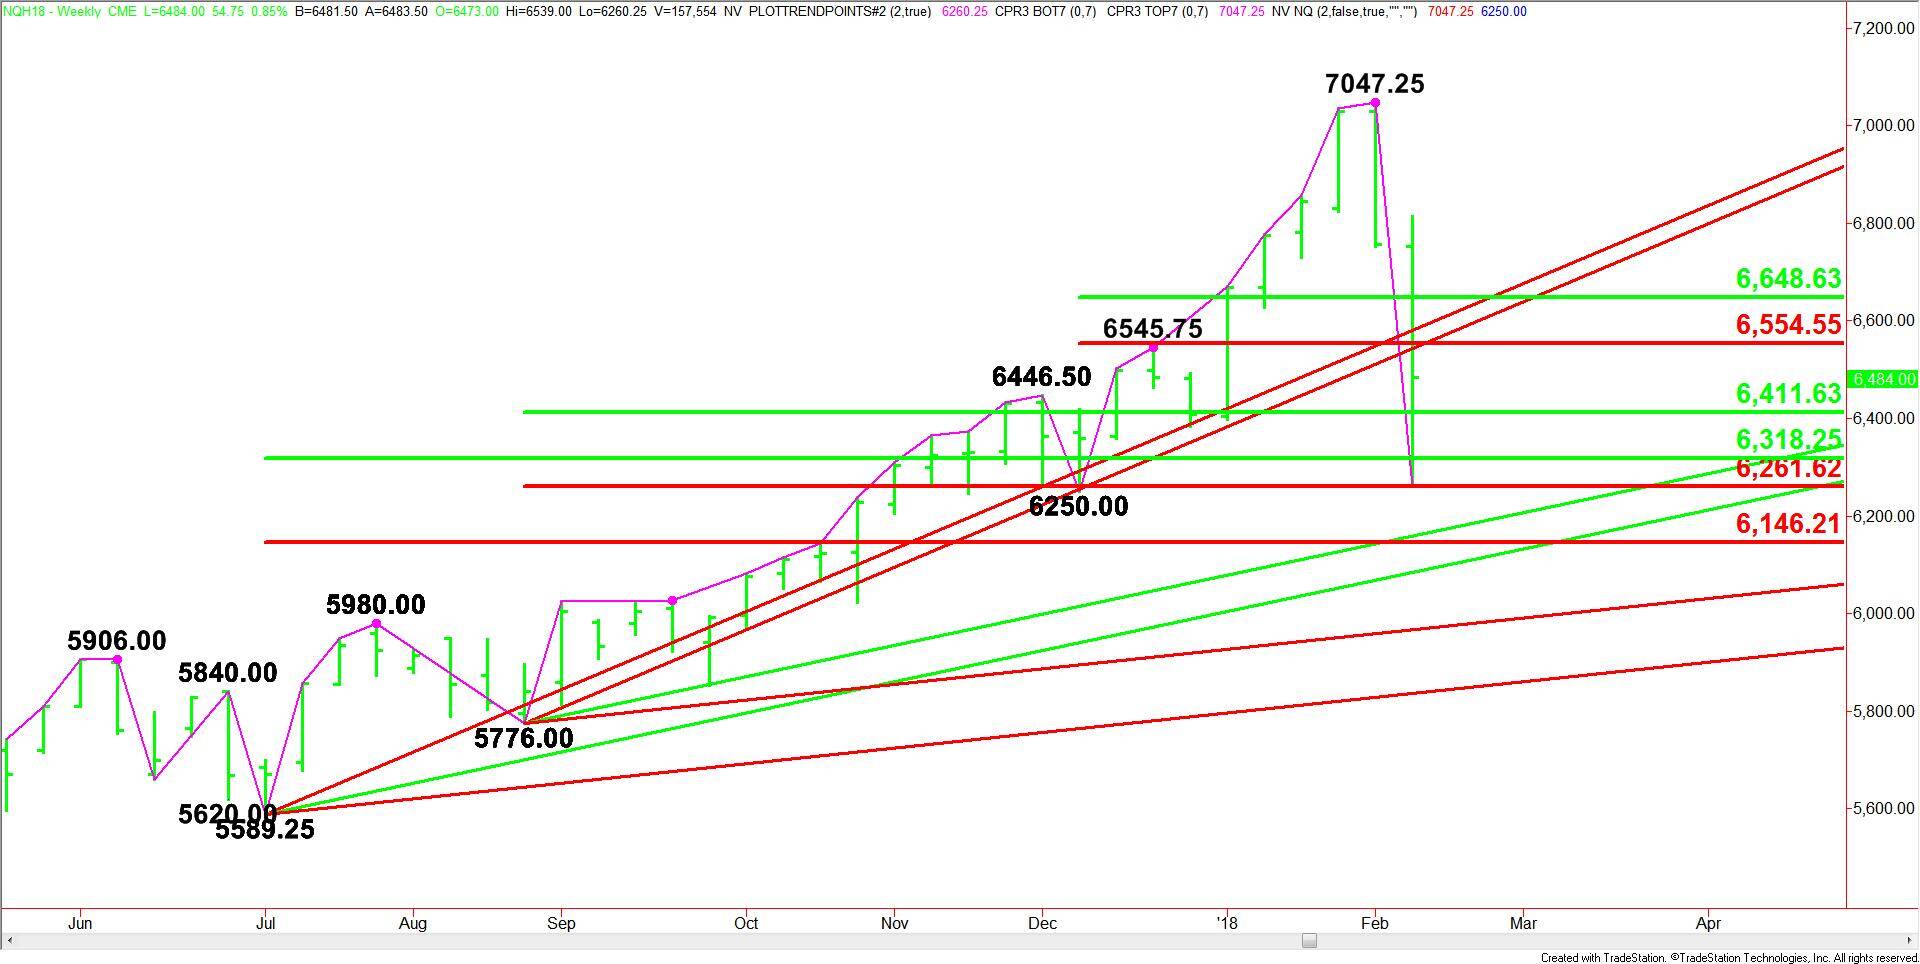
Weekly Swing Chart Analysis
The main trend is up according to the daily swing chart, however, momentum has shifted to the downside. The market came dangerously close to changing the trend to down, but buyers came in when the index hit 6260.25. A trade through 2650.00 will change the main trend to down.
The index is currently chopping around inside a series of retracement levels. This may be causing the two-sided trade.
The first retracement zone is 6411.75 to 6261.50. The second retracement zone is 6318.25 to 6146.25.
On the upside, a retracement zone at 6554.50 to 6648.75 is providing resistance.
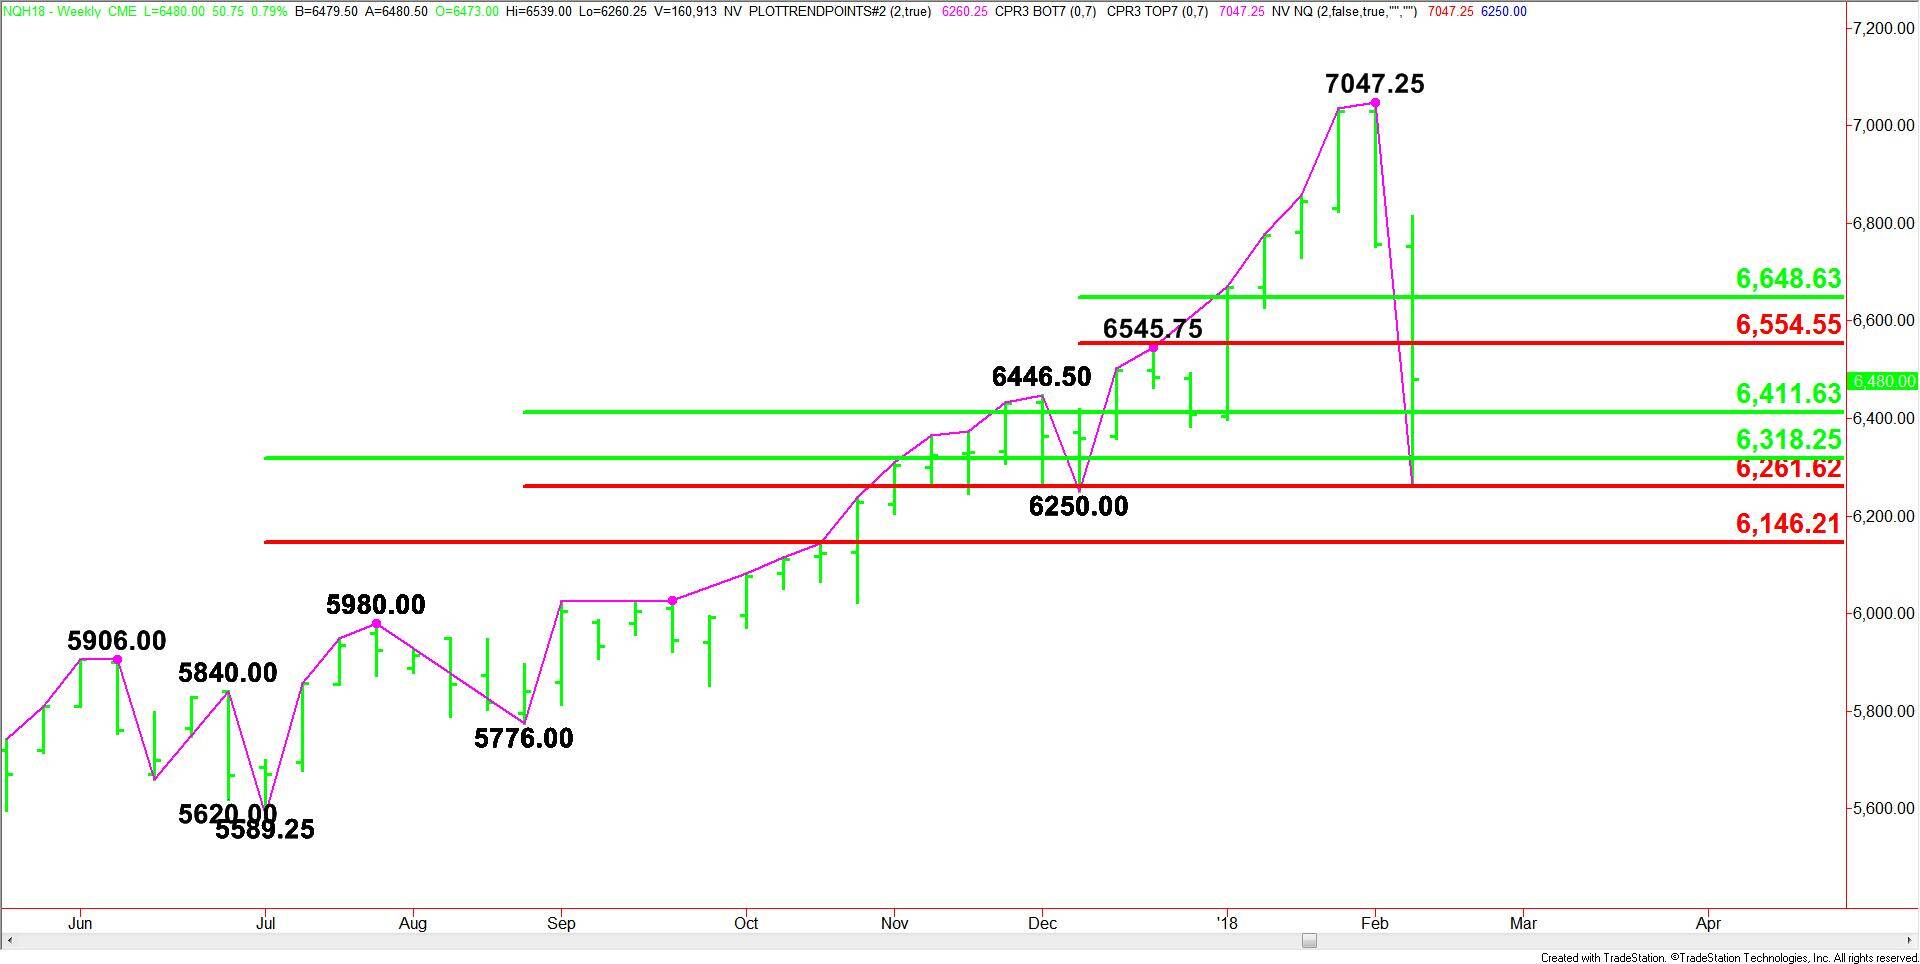
Weekly Swing Chart Forecast
Based on the early trade, holding above 6411.75 will give the index an upside bias. This could trigger a move into a cluster of levels at 6544.00, 6554.50 and 6581.25.
Overtaking 6581.25 could lead to a test of 6648.75. This is a possible trigger point for a further acceleration to the upside.
The market could begin to weaken again if 6411.75 fails as support. This could lead to a choppy, two-sided trade as the market tests a series of retracement levels at 6318.25, 6261.50 and 6146.25.
The Fibonacci level at 6146.25 is the trigger point for an acceleration to the downside. Slowing down the potential acceleration are a series of uptrending Gann angles at 6160.00, 6085.25, 5968.00 and 5837.25.
Stripping out the Gann angles, it looks like trader reaction to 6411.75 and 6146.25 will set the tone for today.