



September E-mini NASDAQ-100 Index futures are trading higher shortly before the cash market opening. The market is recovering from a successful test of a key Fibonacci level, slightly above a previous main bottom.
Technical Analysis
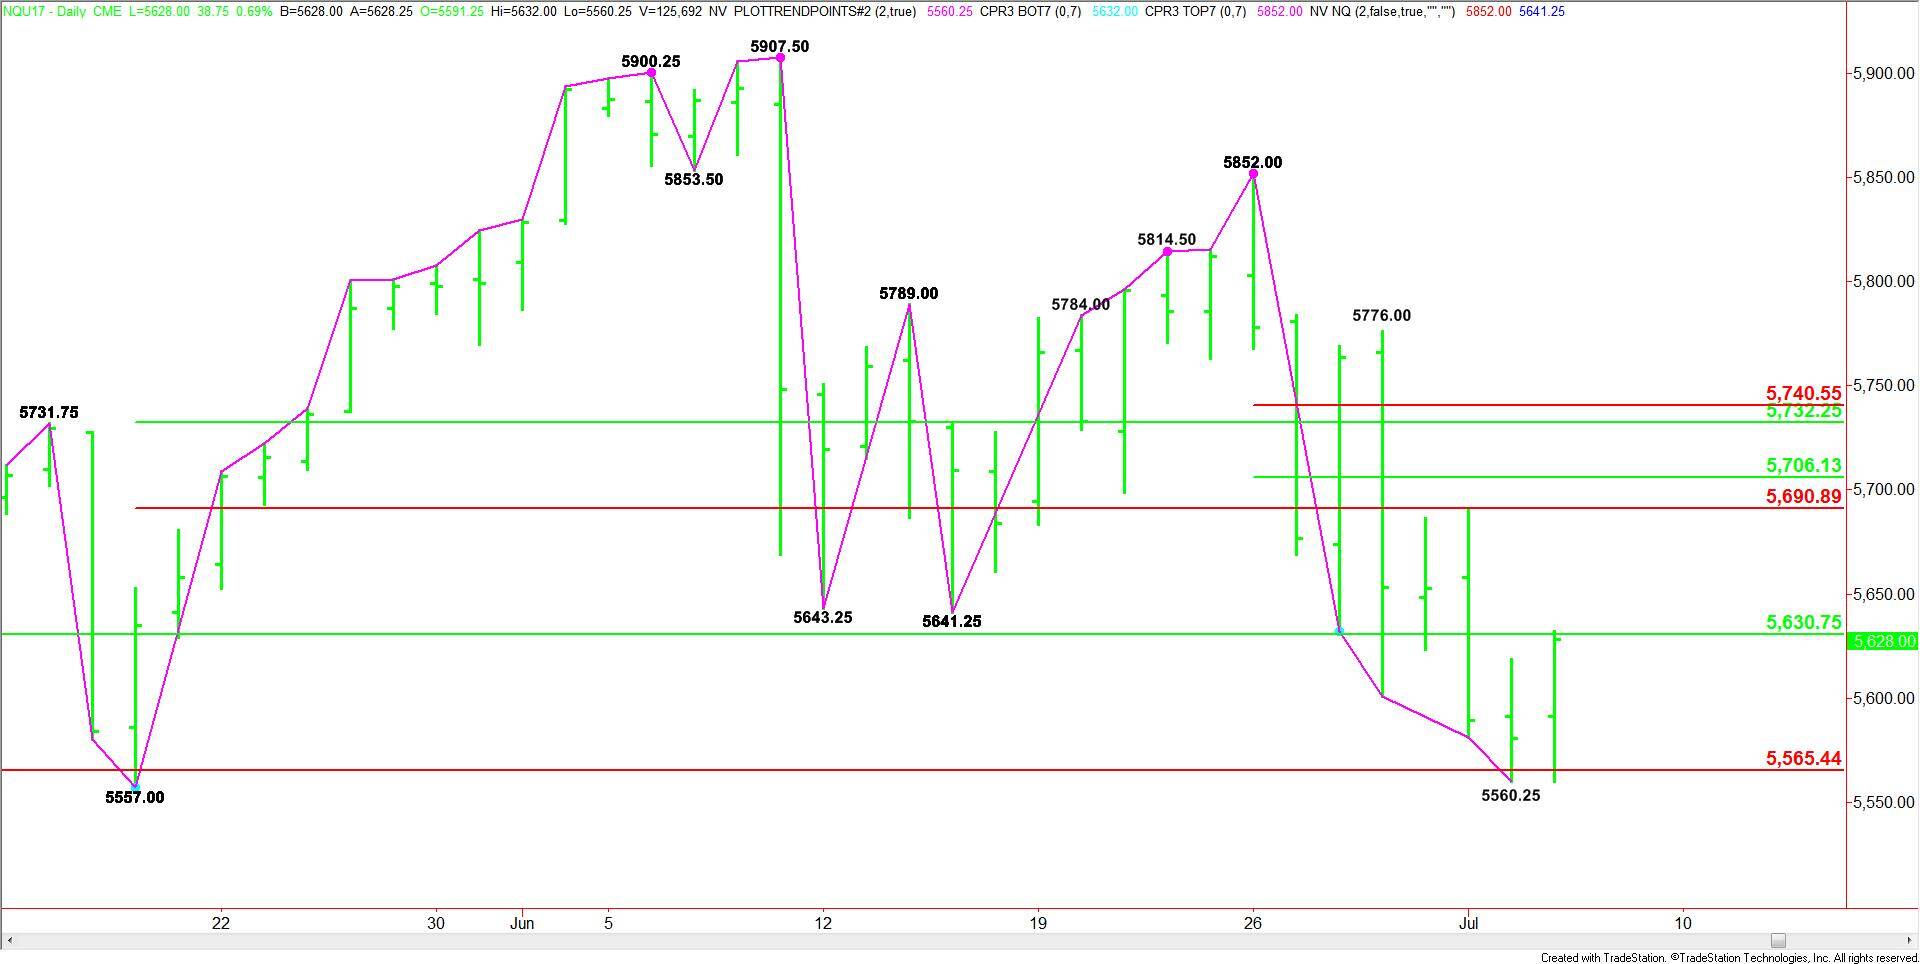
The main trend is down according to the daily swing chart. A trade through 5557.00 will signal a resumption of the downtrend.
The market found support at a major Fibonacci level at 5565.50. This is followed by the May 18 main bottom at 5557.00.
Forecast
The support today is 5565.50, 5560.25 and 5557.00.
If the upside momentum continues then look for buyers to make a run at 5630.75. Overtaking this 50% level could trigger an acceleration to the upside with a Fibonacci level at 5691.00 the next upside target. This is followed by a short-term 50% level at 5706.25.