



September E-mini NASDAQ-100 Index futures are trading lower during the pre-market session. Yesterday, the market posted a strong technical bounce to the upside after posting a potentially bullish closing price bottom.
Early Thursday, the chart pattern was confirmed when buyers took out yesterday’s high. The subsequent buying wasn’t strong enough to continue the upside momentum and the index is staring to settle into a range.
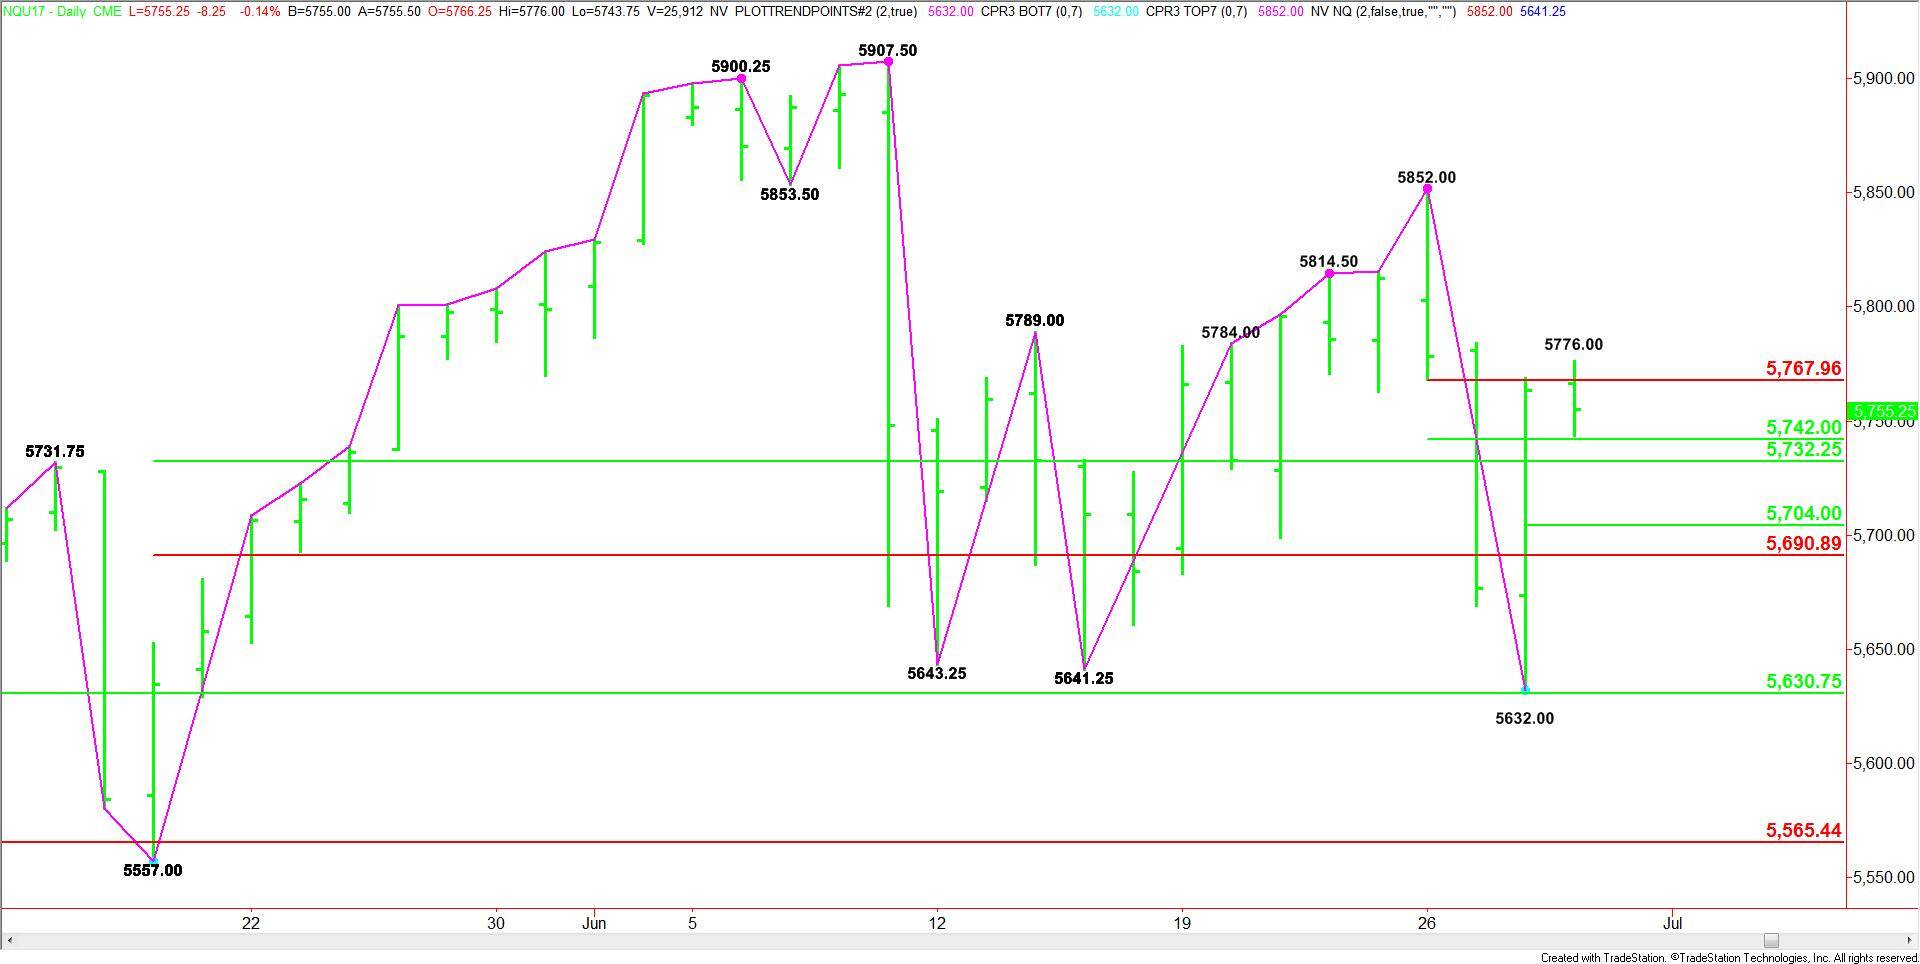
The main trend is down according to the daily swing chart. It turned down early Wednesday when the index took out the previous main bottom at 5641.25. The trend will change back to up when buyers take out the swing top at 5852.00.
The main retracement zone support is 5630.75 to 5565.50. The upper or 50% level of this zone was tested successfully when the index reached 5632.00 before mounting a strong rebound rally.
The intermediate range is 5557.00 to 5907.50. Its retracement zone is 5732.25 to 5691.00. The index has been straddling this zone all month so it should help us determine the near-term direction of the index.
The short-term range is 5852.00 to 5832.00. Its retracement zone is 5742.00 to 5768.00. This zone was tested early and the index is trading inside it at this time.
Another short-term range is 5632.00 to 5776.00. If there is a sell-off today, then its retracement zone at 5704.00 to 5691.00 will become the primary downside target.
Forecast
Given the current price at 5755.00, the direction of the index today is likely to be determined by trader reaction to 5768.00 and 5742.00.
A sustained move over 5768.00 will signal the return of buyers. This could eventually drive the index into this week’s high at 5852.00.
A sustained move under 5742.00 will indicate the presence of sellers. The first target is 5732.25. The chart then opens up to the downside with the next major targets 5704.00 to 5691.00.
Look for a bullish tone to develop on a sustained move over 5768.00 and for a downside bias to develop on a sustained move under 5732.25. Otherwise, the index will be rangebound today.