


June E-mini NASDAQ-100 Index futures are called higher based on the pre-market trade. Prices continue to be boosted by yesterday’s report of lower-than-expected consumer inflation that could mean the Fed will be less-aggressive when raising interest rates later this year.
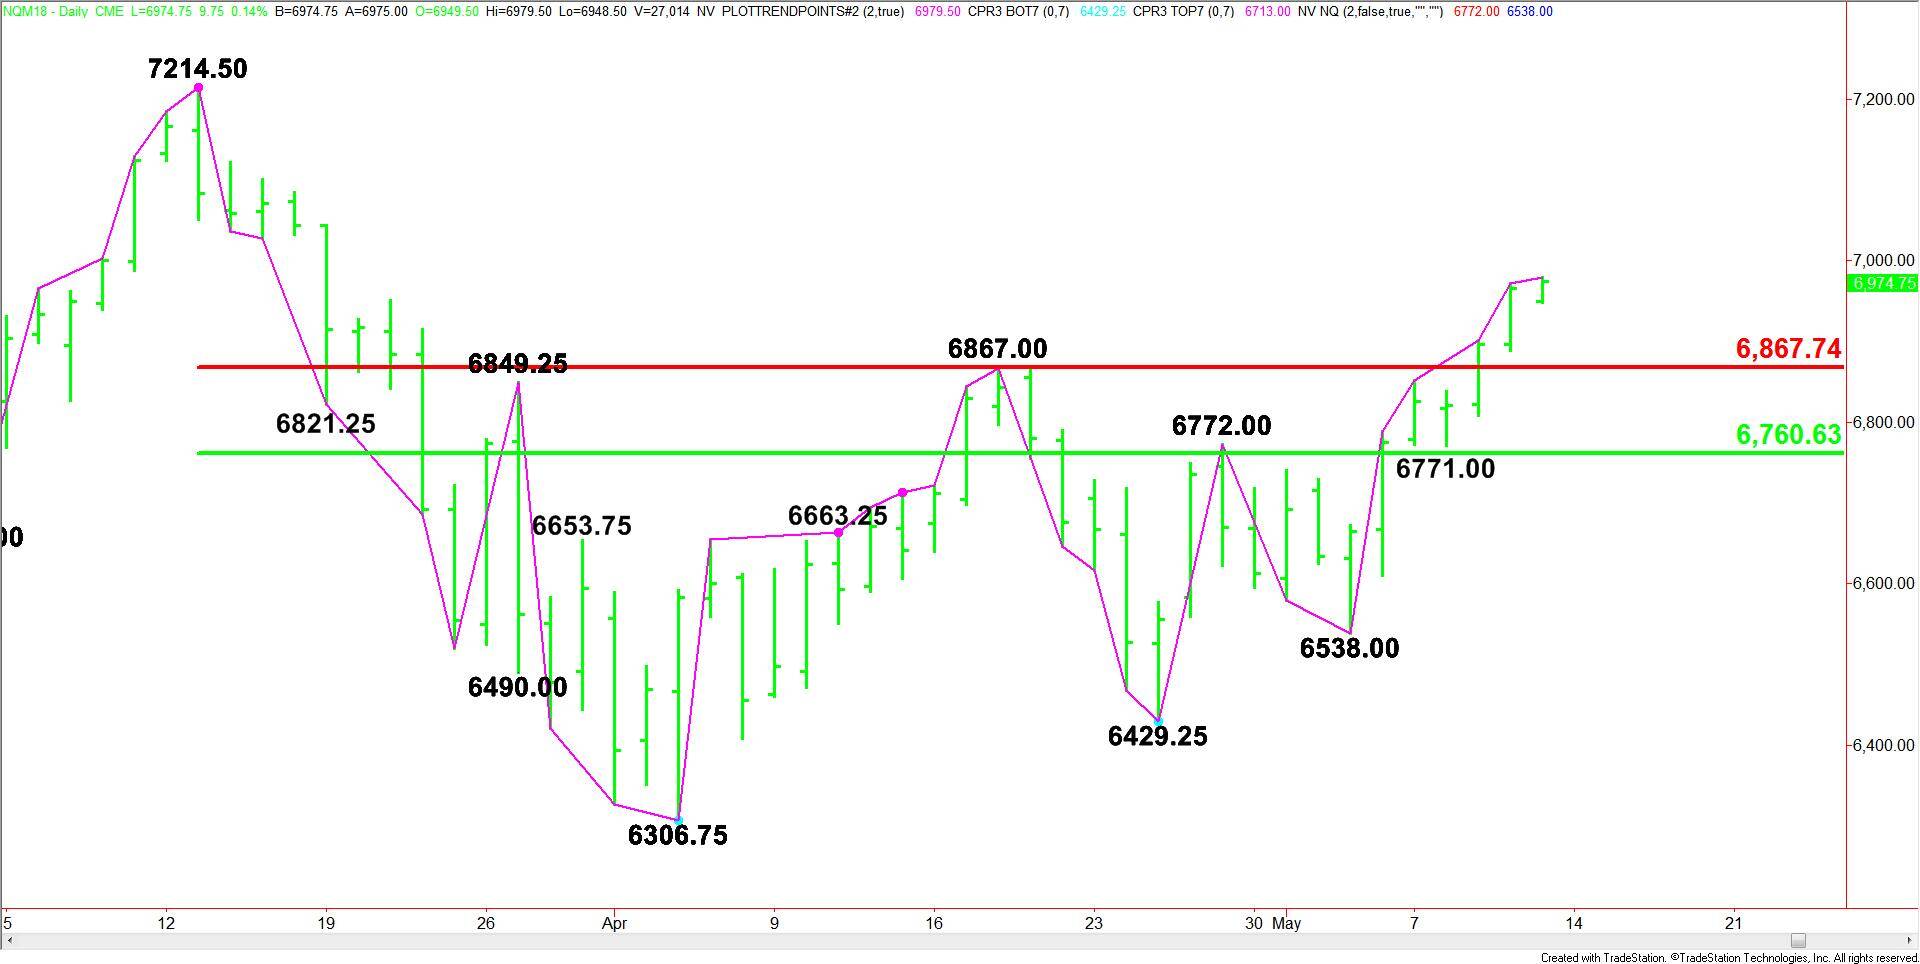
Daily Swing Chart Technical Analysis
The main trend is up according to the daily swing chart. Earlier this week, buyers cleared a key hurdle at 6867.00, putting the index in a position to eventually challenge the next major top at 7214.50.
The market isn’t close to changing the trend to down, but this kind of rally tends to end with a closing price reversal bottom. Don’t expect a change in trend, however. We may only see a 2 to 3 day correction.
The main range is 7214.50 to 6306.75. The index is currently trading on the strong side of its retracement zone at 6867.75 to 6760.50. This area is new support.
Daily Swing Chart Technical Forecast
Since we’re trading on the strong side of a key retracement zone, we expect to see the index strengthen over the near-term. Therefore, momentum will be the driving force in the market. The first sign of weakness will be a break back below the previous day’s close.
Watch the price action and read the order flow at 6965.00 all session. A sustained move over this level will indicate the presence of buyers.
A sustained move under 6965.00 will signal the return of sellers. This will also put the index in a position to form a closing price reversal top.