



December E-mini NASDAQ-100 Index futures are called lower shortly before the cash market opening. However, the index is bouncing back following an earlier sell-off, perhaps creating enough upside momentum to turn the market higher for the day.
Daily Technical Analysis
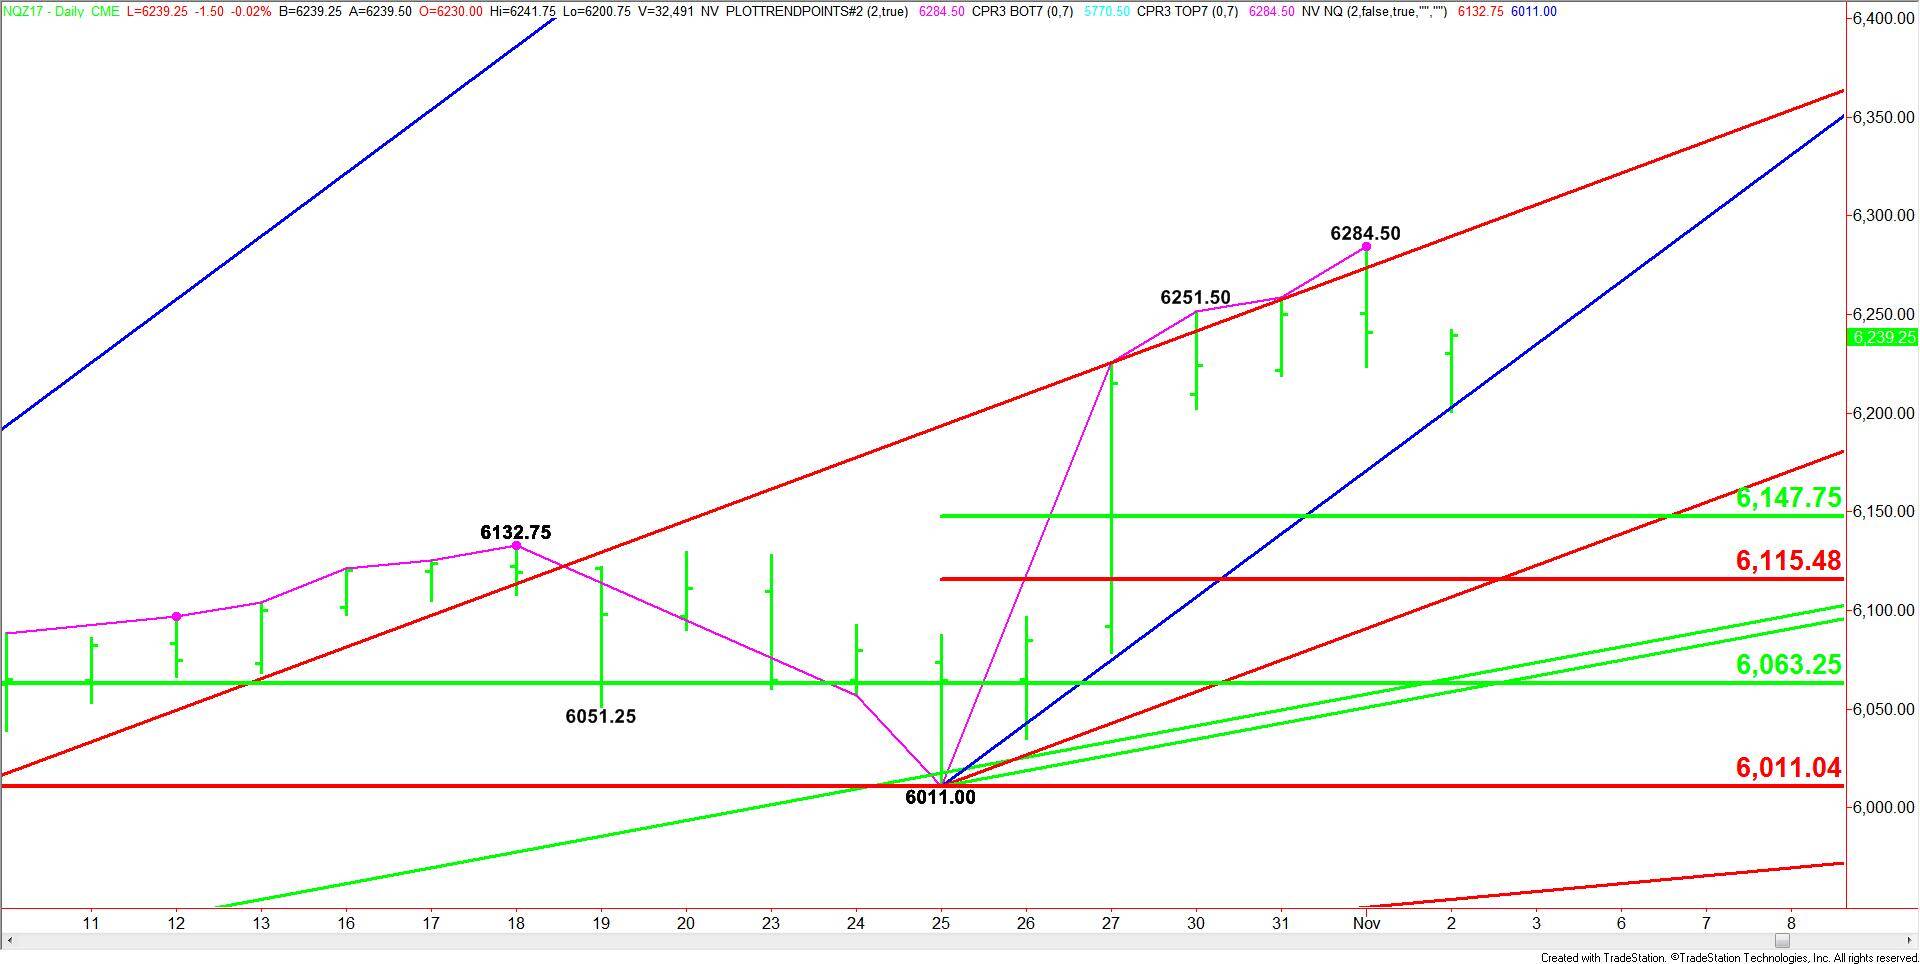
The main trend is up according to the daily swing chart, however, momentum shifted to the downside with the formation and confirmation of a potentially bearish closing price reversal top.
A trade through 6284.50 will negate the chart pattern and signal a resumption of the uptrend.
The short-term range is 6011.00 to 6284.50. If the sell-off resumes then look for an extension of the move into the retracement zone at 6147.75 to 6115.50. Since the main trend is up, we could see a technical bounce on the first test of this zone.
Daily Forecast
Based on the earlier price action, the direction of the NASDAQ-100 Index the rest of the session is likely to be determined by trader reaction to the steep uptrending angle at 6203.00.
A sustained move over 6203.00 will indicate the presence of buyers. This could create enough upside momentum to challenge 6284.50. This is followed by a steep uptrending angle at 6290.00. Crossing to the strong side of this angle will put the market in an extremely strong position.
A sustained move under 6203.00 will signal the presence of sellers. The daily chart is wide open under this angle with the next targets the 50% level at 6147.75, the Fibonacci level at 6115.50 and the uptrending angle at 6107.00.
Look for a bullish bias on a sustained move over 6203.00 and for a bearish bias to emerge on a sustained move under this angle.