



December E-mini NASDAQ-100 Index futures are trading higher shortly before the cash market opening. The market is being supported by strong earnings from Apple which were reported after the close on Thursday. Today, investors will get the opportunity to react to the latest U.S. Non-Farm Payrolls report.
Daily Technical Analysis
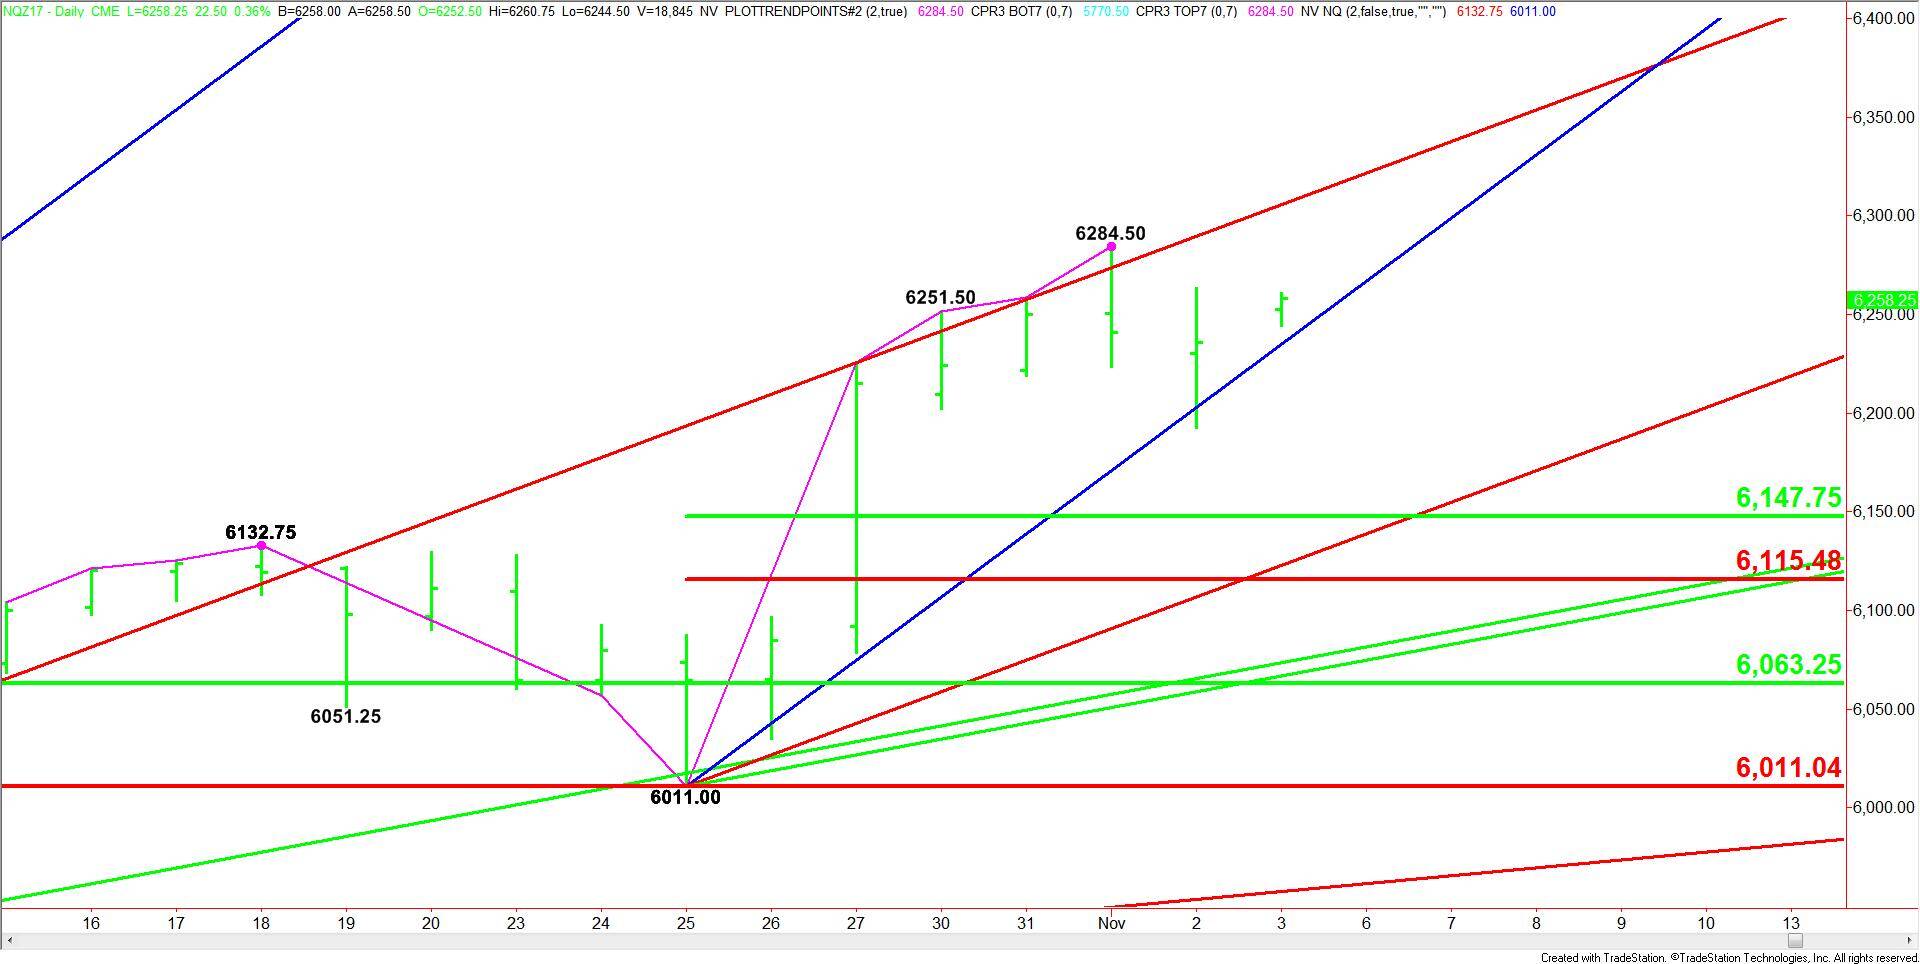
The main trend is up according to the daily swing chart, but momentum has shifted to the downside with the formation of the closing price reversal top on November 1 and the subsequent follow-through selling.
A trade through 6284.50 will negate the closing price reversal top and signal a resumption of the uptrend. A move through 6192.50 will take out yesterday’s low and indicate that the downside momentum is getting stronger.
The short-term range is 6011.00 to 6284.50. If the selling pressure gets stronger then its retracement zone at 6147.75 to 6115.50 will become the primary downside target.
Daily Forecast
Based on the early trade, the direction of the market today is likely to be determined by trader reaction to the steep uptrending angle at 6235.00.
A sustained move over 6235.00 will indicate the presence of buyers. The daily chart is wide open to the upside with the next target the closing price reversal top at 6284.50.
Overtaking 6284.50 could extend the rally into a long-term uptrending angle at 6123.00. Crossing to the strong side of this angle will put the NASDAQ-100 in an extremely bullish position.
A sustained move under 6235.00 will signal the presence of sellers. The daily chart is wide open to the downside so we could see an acceleration to the downside with the first major target the 50% level at 6147.75.
Watch the price action and read the order flow on a test of 6235.00. Trader reaction to this angle will tell us if the buying or selling is getting stronger.