


An index of technology stocks is trading higher on Tuesday, shortly after the cash market opening. Volume is light as investors prepare for the results of the U.S. mid-term elections. Traders can’t agree on the outcome of the elections which is why they are bracing for heightened volatility. The latest poll shows the Democrats leading with a 7 point advantage.
At 1550 GMT, December E-mini NASDAQ-100 Index futures are trading 7004.00, up 54.50 or +0.73%.
Daily Swing Chart Technical Analysis
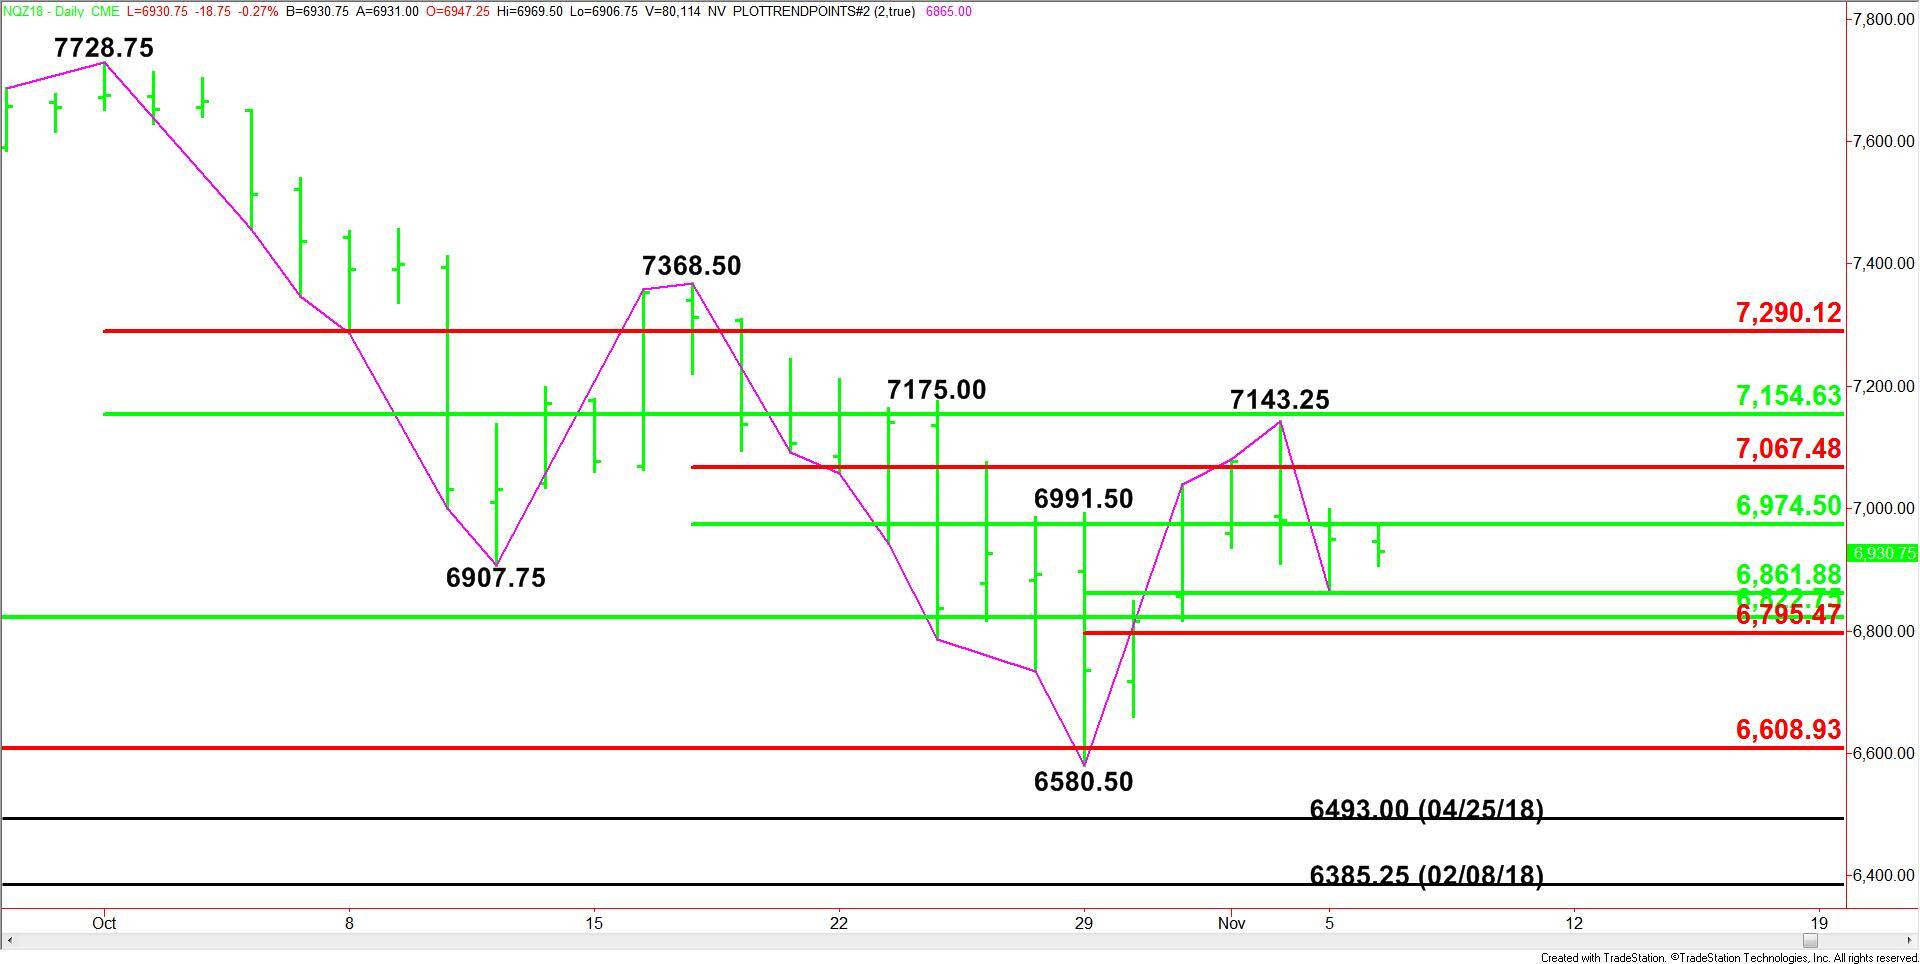
The main trend is down according to the daily swing chart. However, momentum is trending higher. A trade through 7143.25 will change the main trend to up with the next target a main top at 7368.50. A move through 6580.50 will signal a resumption of the downtrend with 6493.00 and 6385.25 the next targets.
Daily Swing Chart Technical Forecast
Based on the early trade, the direction of the December E-mini NASDAQ-100 Index on Tuesday is likely to be determined by trader reaction to the 50% level at 6974.50.
A sustained move over 6974.50 will indicate the presence of buyers. If this move generates enough upside momentum then look for a surge into the Fibonacci level at 7067.50. This is also the trigger point for an acceleration into the main top at 7143.25 and the major 50% level at 7154.75.
A sustained move under 6974.50 will signal the presence of sellers. If this move generates enough downside momentum then look for a possible break into a series of levels at 6861.75, followed by 6822.75 then 6795.50.
We’re not looking for much movement today. We’re also looking for below average volume. The early price action suggests a range of 6861.75 to 7067.50 with 6974.50 acting like a pivot throughout the day.