
Advertisement
Advertisement
E-mini NASDAQ-100 Index (NQ) Futures Technical Analysis – October 10, 2014 Forecast
By:
December E-mini NASDAQ-100 Index futures tried to follow-through to the upside on Thursday, but buyers failed to show up slightly above the short-term
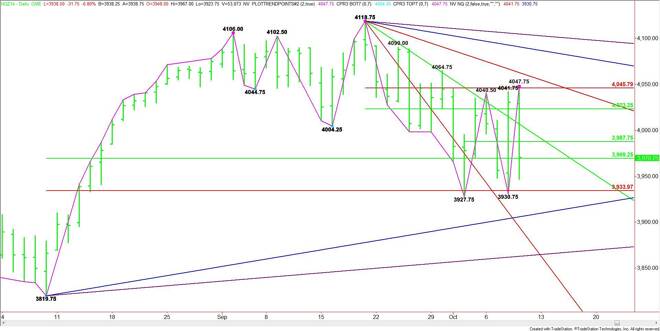
December E-mini NASDAQ-100 Index futures tried to follow-through to the upside on Thursday, but buyers failed to show up slightly above the short-term Fibonacci level at 4045.75. The index actually reached a high of 4047.75 before selling off hard throughout the session.
The subsequent break took the market back to the major retracement zone at 3969.25 to 3934.00 where it found support slightly above a pair of bottoms at 3930.75 and 3927.75.
Given the bottom at 3927.75 and the top at 4047.75, traders should watch the price action at the mid-point of this range at 3987.75. Trader reaction to this price level could set the tone for the day.
If sellers win the battle then watch for another test of the Fib level at 3934.00. This is followed by the bottoms at 3930.75 and 3927.75. Taking out these bottoms will trigger a break into the nearest uptrending angle at 3907.75, followed by the next angle at 3863.75. This is the last support angle before the August 8 bottom at 3819.75.
Holding above 3987.75 will indicate developing strength. This could lead to a test of the downtrending angle at 3998.75. Taking out this angle with conviction will lead to a test of 4023.25 then 4045.75.
Additional resistance levels come in a 4047.75, 4058.75 and 4088.75.
Because of the large number of retracement levels concentrated in a tight area, watch for a two-sided trade today with the pivot at 3987.75 being the key level which will control the direction of the market today. Look for strength above it and weakness below it.
About the Author
James Hyerczykauthor
James Hyerczyk is a U.S. based seasoned technical analyst and educator with over 40 years of experience in market analysis and trading, specializing in chart patterns and price movement. He is the author of two books on technical analysis and has a background in both futures and stock markets.


Advertisement