
Advertisement
Advertisement
E-mini NASDAQ-100 Index (NQ) Futures Technical Analysis – October 2, 2014 Forecast
By:
December E-mini NASDAQ-100 Index futures sold-off sharply on Wednesday, reaffirming the main downtrend. The close near the low suggests more downside
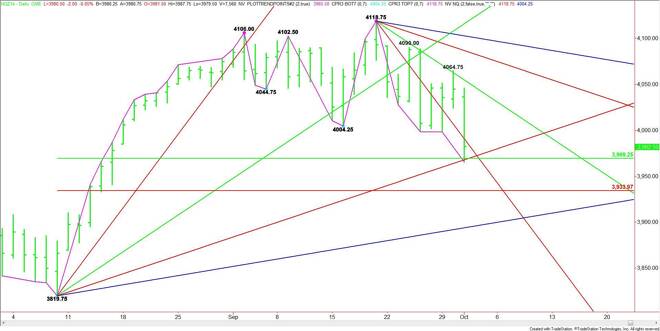
December E-mini NASDAQ-100 Index futures sold-off sharply on Wednesday, reaffirming the main downtrend. The close near the low suggests more downside pressure today, however, the market is currently testing a major 50% level and a major uptrending angle.
Counter-trend buyers may use this area as a reason to get long and short-sellers may decide to begin booking profits. So be prepared for a technical bounce if there is no follow-through selling. In addition, the index is in the window of time to form a potentially bullish closing price reversal chart pattern.
The main range is 3819.75 to 4118.75. The retracement zone created by this range is 3969.25 to 3934.00. The upper, or 50% level was tested successfully on Wednesday, producing a slight technical bounce. The market also tested a long-term uptrending angle from the 3819.75 bottom. This angle is at 3971.75 today.
If sellers drive the market through the 50% level at 3969.25 then look for a break into the Fibonacci level at 3934.00. If this level fails then the angle at 3895.75 is the next target.
A downtrending angle comes in at 3974.75. The close at 3982.50 has put the index on the bullish side of this angle. Crossing below it will be a sign of weakness.
A sustained move over 3974.75 could encourage short-covering. The first potential upside target is a downtrending angle at 4046.75.
The tone of the market today will be determined first by trader reaction to 3974.75 then 3969.25.
About the Author
James Hyerczykauthor
James Hyerczyk is a U.S. based seasoned technical analyst and educator with over 40 years of experience in market analysis and trading, specializing in chart patterns and price movement. He is the author of two books on technical analysis and has a background in both futures and stock markets.


Advertisement