



March E-mini NASDAQ-100 Index futures are trading flat shortly after the cash market opening. Volume is below average as investors shift into holiday mode ahead of Christmas and New Year’s.
Daily Technical Analysis
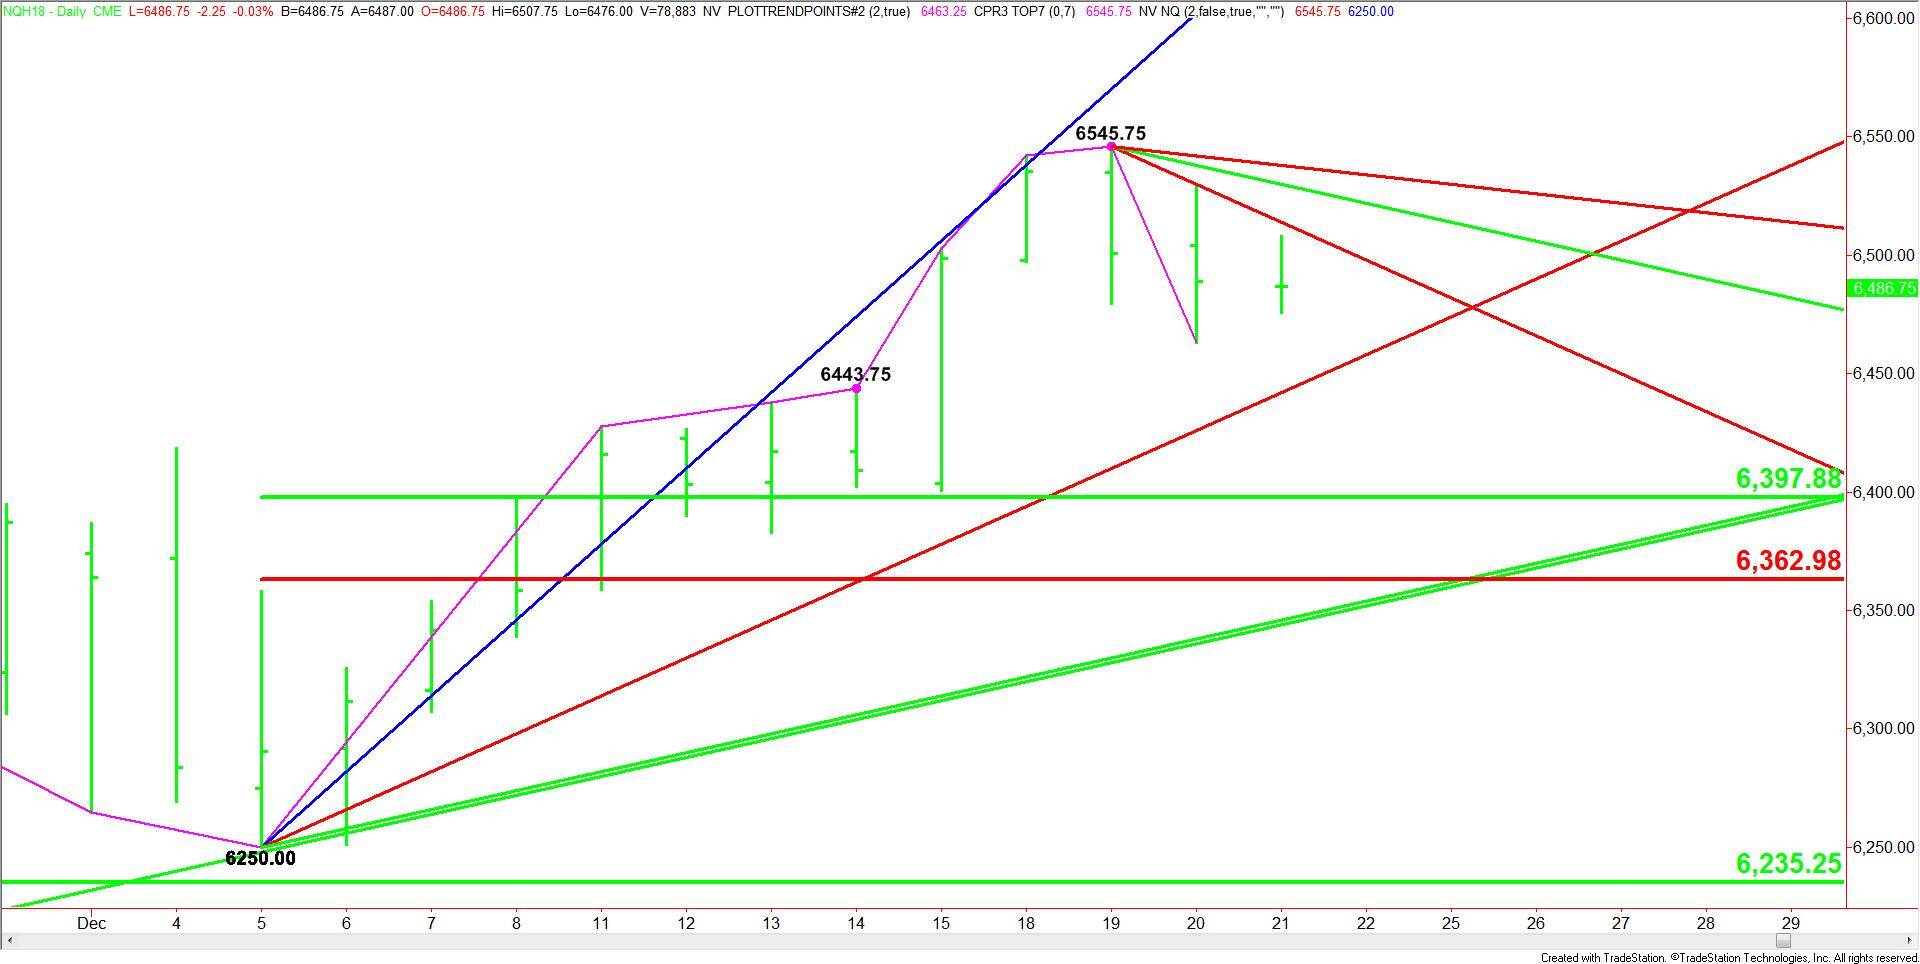
The main trend is up according to the daily swing chart. However, momentum shifted lower with the formation of the closing price top on December 19 and the subsequent confirmation on Wednesday. This chart pattern tends to lead to a 2 to 3 day correction of about 50% to 61.8% of the last rally. However, it works best when there is strong selling volume.
A trade through 6545.75 will negate the chart pattern and signal a resumption of the uptrend. A trade through 6463.25 will indicate the selling is getting stronger.
Daily Technical Forecast
Based on the current price action, the nearest resistance is a downtrending Gann angle at 6513.75, followed by additional angles at 6529.75 and 6537.75. The latter is the last potential resistance angle before the 6545.75 main top.
If the selling pressure resumes then we could see a test of a longer-term uptrending Gann angle at 6442.00. Since the trend is up, buyers could come in on a test of this angle. If it is taken out with rising volume, we could see an acceleration into at least 6398.00.