



June E-mini NASDAQ-100 Index futures took out the previous week’s low last week before closing higher in this holiday shortened week.
Weekly Technical Analysis
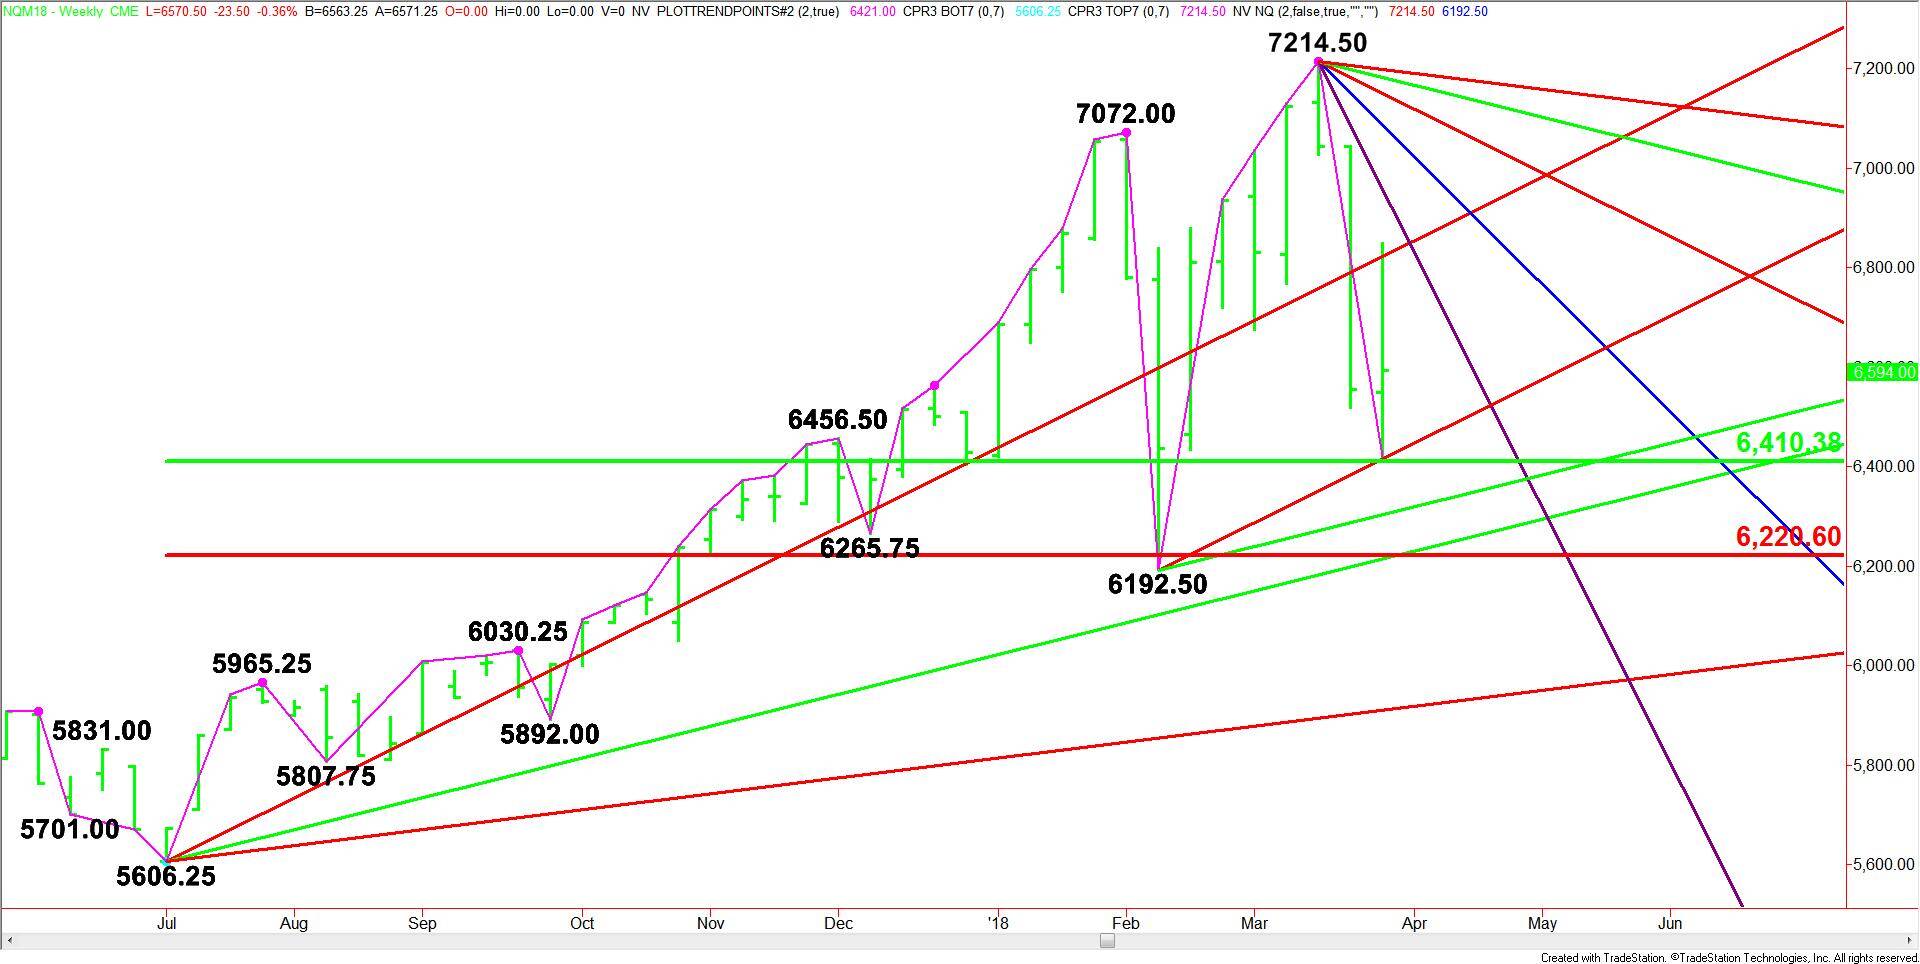
The main trend is up according to the weekly swing chart, but momentum has been trending lower since the formation of a closing price reversal top the week-ending March 16. This chart pattern typically leads to a 2 to 3 week break so we may have completed the move last week, or we’ll see more downside this week.
A trade through 6192.50 will change the main trend to down. A move through 7214.50 will negate the closing price reversal top and signal a resumption of the uptrend.
The main range is 5606.25 to 7214.50. Its retracement zone at 6410.25 to 6220.50 is the primary downside target. Last week’s low came in at 6221.00.
Weekly Technical Forecast
Based on last week’s price action, the direction of the index this week is likely to be determined by trader reaction to the uptrending angle that stopped the market last week. This angle comes in at 6448.50.
A sustained move over 6448.50 will indicate the presence of buyers. The weekly chart shows there is plenty of room to the upside with the first targets coming in at 6830.50 and 6854.25.
Crossing to the strong side of the uptrending angle at 6854.25 will put the index in a bullish position. This could create the upside momentum needed to challenge the next downtrending Gann angle at 7022.50.
A sustained move under 6448.50 will signal the presence of sellers. This should lead to a quick test of the 50% level at 6410.25. This is the trigger point for a break into an uptrending Gann angle at 6320.50, followed by a potential support cluster at 6230.25 to 6220.50.
The trigger point for a steep break is 6192.50. If this bottom fails then look for a possible acceleration into the next uptrending Gann angle at 5918.25.