



March E-mini S&P 500 Index futures are trading lower shortly before the cash market opening. Once again, we’re going to keep an eye on the weekly retracement levels due to the heightened volatility.
The main trend is up according to the daily swing chart, however, momentum has shifted to the downside following last week’s closing price reversal top and this week’s subsequent confirmation of the chart pattern.
The minor trend turned down earlier in the week when minor bottoms at 2667.75 and 2556.50 failed.
A trade through 2415.50 will change the main trend to down. Buyers will have to overcome 2878.50 to negate the reversal top and signal a resumption of the uptrend.
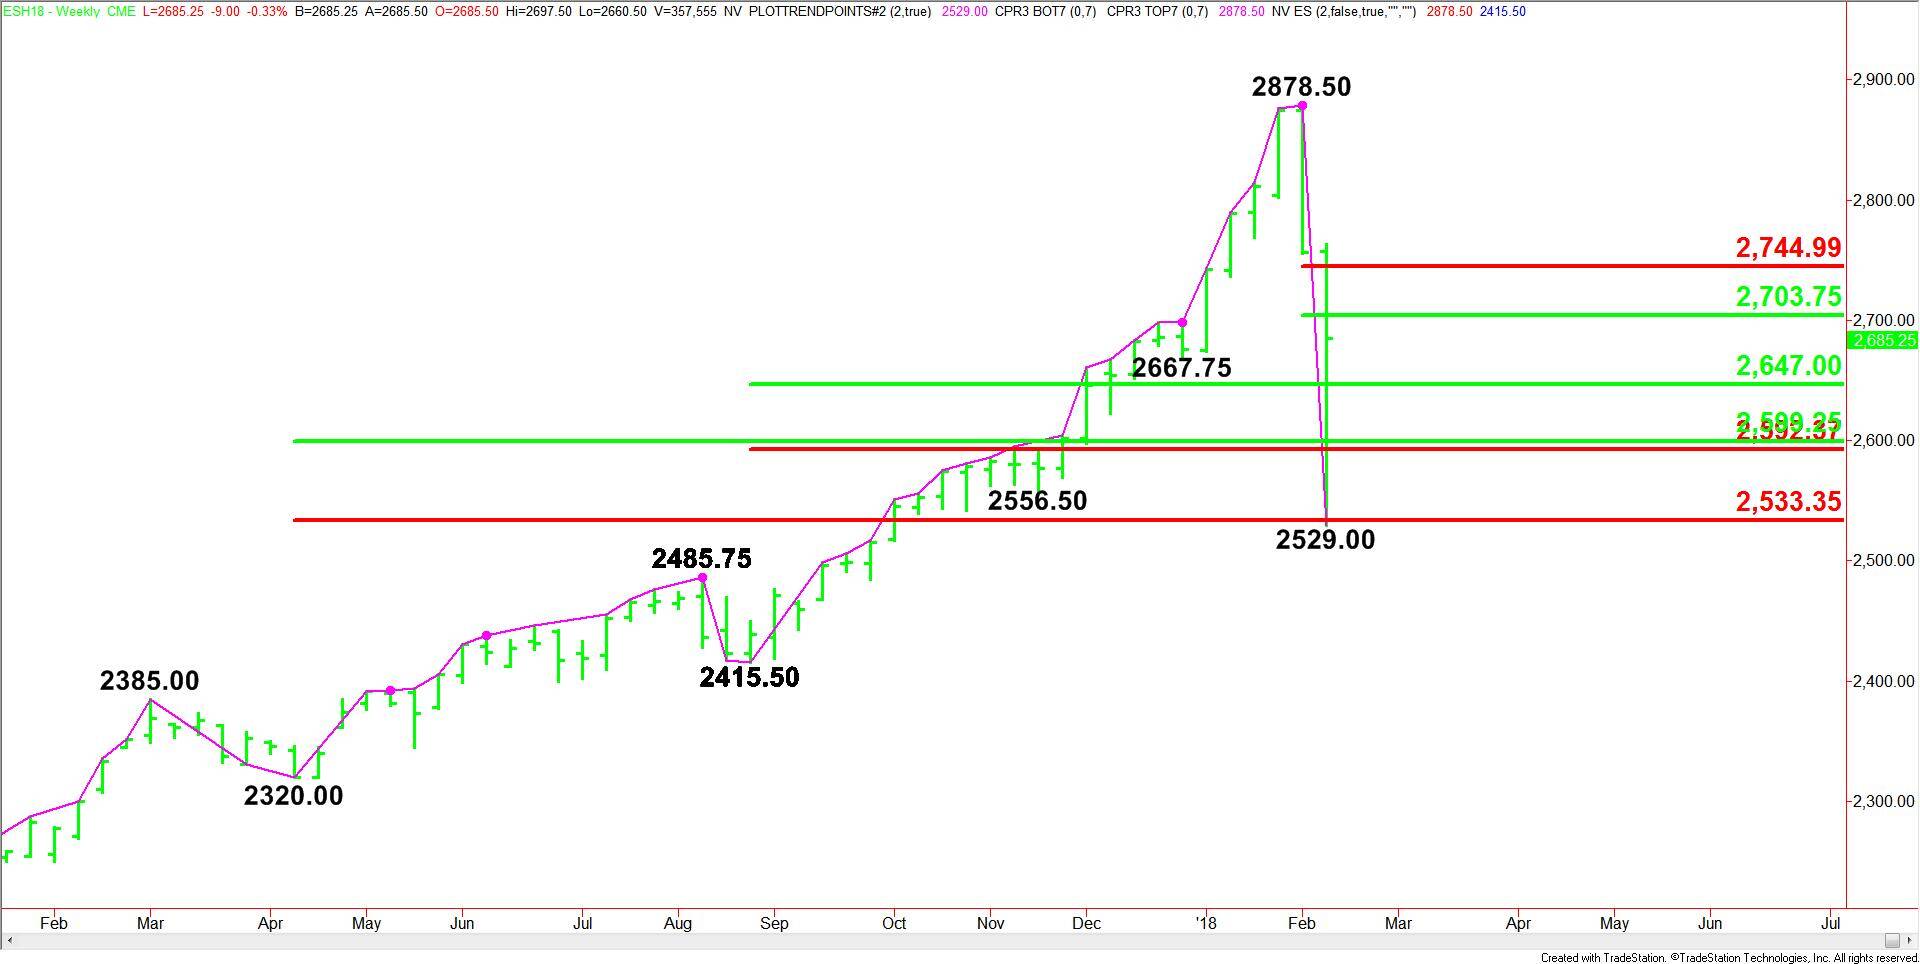
The main range is 2320.00 to 2878.50. Its retracement zone is 2599.25 to 2533.25. On Tuesday, the lower or Fibonacci level provided supported when a test of 2529.00 fueled a late session intraday short-covering rally.
The minor range is 2415.50 to 2878.50. Its retracement zone is 2647.00 to 2592.25. This area could develop into support.
Combining the two retracement zones creates an important pivot area at 2599.25 to 2592.25.
The short-term range is 2878.50 to 2529.00. Its retracement zone is 2703.75 to 2745.00. This zone provided resistance earlier today.
Switching back to the daily chart, the short-term range is 2529.00 to 2699.75. Its retracement zone is 2614.25 to 2594.25. This area could become support if tested successfully. We’re going to be watch this area because of the possibility of a secondary higher bottom forming.
Forecast
Based on the early trade, a trade through 2699.75 will confirm Tuesday’s closing price reversal bottom. This should lead to a quick test of the retracement zone at 2703.75 to 2745.00.
A sustained move over 2703.75 will indicate the presence of buyers. A move over 2745.00 will indicate the buying is getting stronger. Possible downtrending Gann angle resistance comes in at 2766.50 and 2822.50.
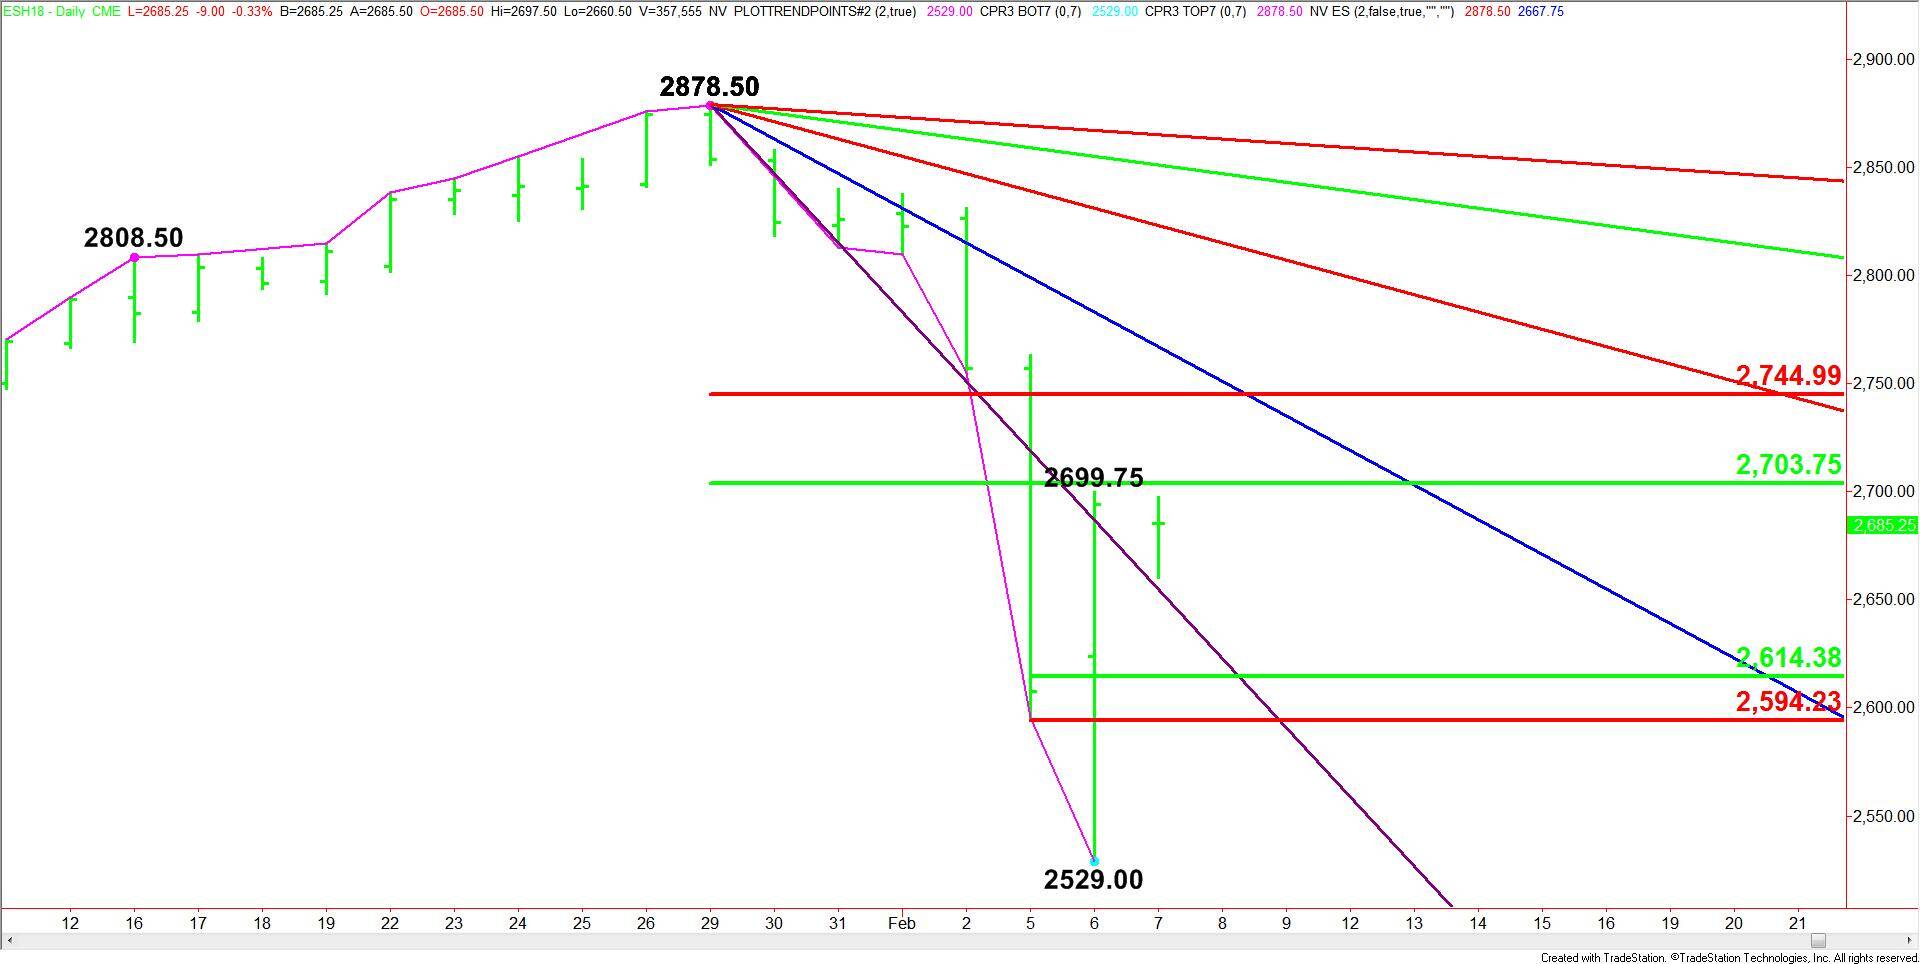
A sustained move under 2703.75 will signal the presence of sellers. Crossing under the steep downtrending Gann angle at 2654.50 will indicate the selling is getting stronger. This could lead to a further break into 2614.25 to 2594.25.
If 2614.25 to 2594.25 is tested successfully then a secondary higher bottom could form. This will be potentially bullish. If the zone fails then look for the selling to possibly extend into 2529.00.