


March E-mini S&P 500 Index futures are trading sharply lower in reaction to steep breaks in Asia and Europe. The catalysts behind the weakness are the dovish tone by the European Central Bank (ECB) and weaker-than-expected trade balance data from China. Position-squaring ahead of today’s U.S. February Non-Farm Payrolls report is also weighing on prices.
At 12:53 GMT, March E-mini S&P 500 Index futures are trading 2737.75, down 12.75 or -0.45%.
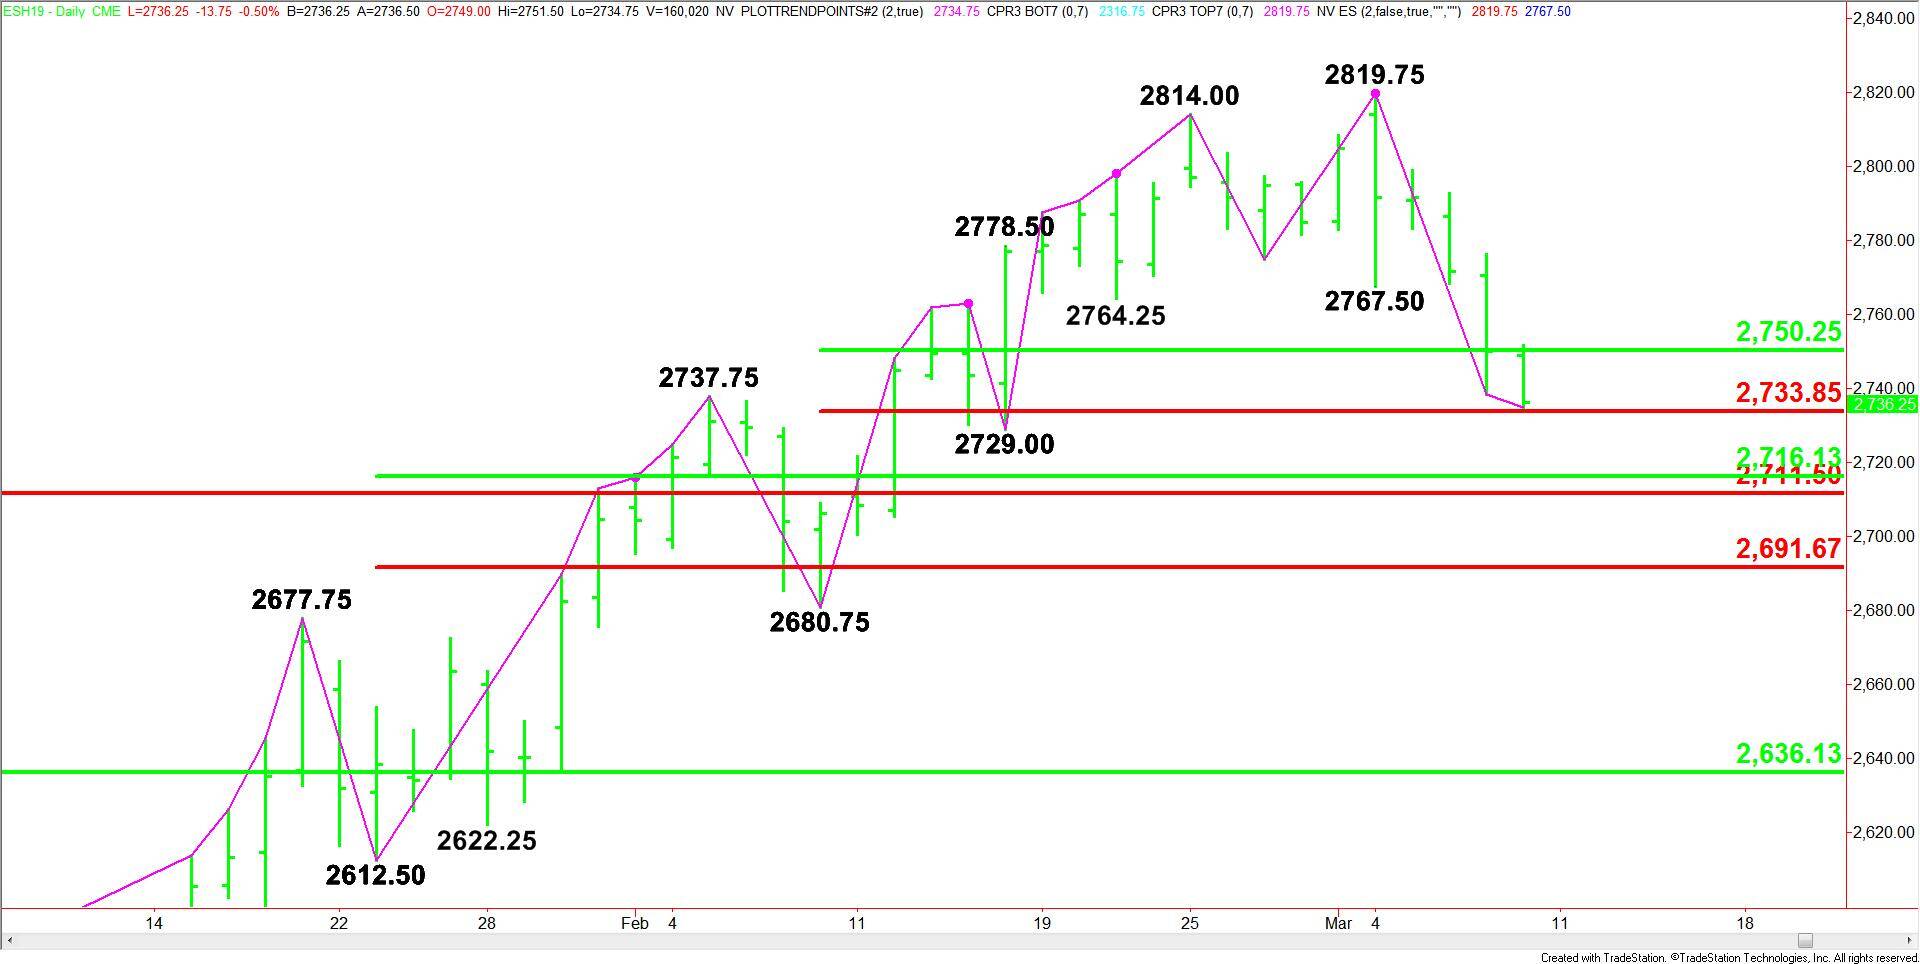
Daily Swing Chart Technical Analysis
The main trend is down according to the daily swing chart. A trade through 2729.00 will reaffirm the downtrend.
The short-term range is 2680.75 to 2819.75. The index is currently testing the lower-end of its retracement zone at 2750.25 to 2733.75.
The main range is 2612.50 to 2819.75. Its retracement zone at 2716.00 to 2691.50 is the next downside target.
A major longer-term Fibonacci level and the main 50% level combine to form a support zone at 2716.00 to 2711.50. Look for buyers to come in on a test of this area.
Daily Swing Chart Technical Forecast
Based on the early price action, the direction of the March E-mini S&P 500 Index on Friday is likely to be determined by trader reaction to the Fib level at 2733.75.
Bullish Scenario
A sustained move over 2733.75 will indicate the presence of buyers. If this creates enough upside momentum then look for a test of the 50% level at 2750.25. Since the main trend is down, sellers could come in on the first test of this level. Overtaking 2750.25 could trigger an acceleration to the upside.
Bearish Scenario
A sustained move under 2733.75 will signal the presence of sellers. The next target is the main bottom at 2729.00. If this price fails then look for an acceleration into the support cluster at 2716.00 to 2711.50.