



June E-mini S&P 500 Index futures are trading lower early Tuesday ahead of the release of Apple’s latest quarterly results and the start of the U.S. Federal Reserve’s two-day monetary policy meeting.
Daily Swing Chart Technical Analysis
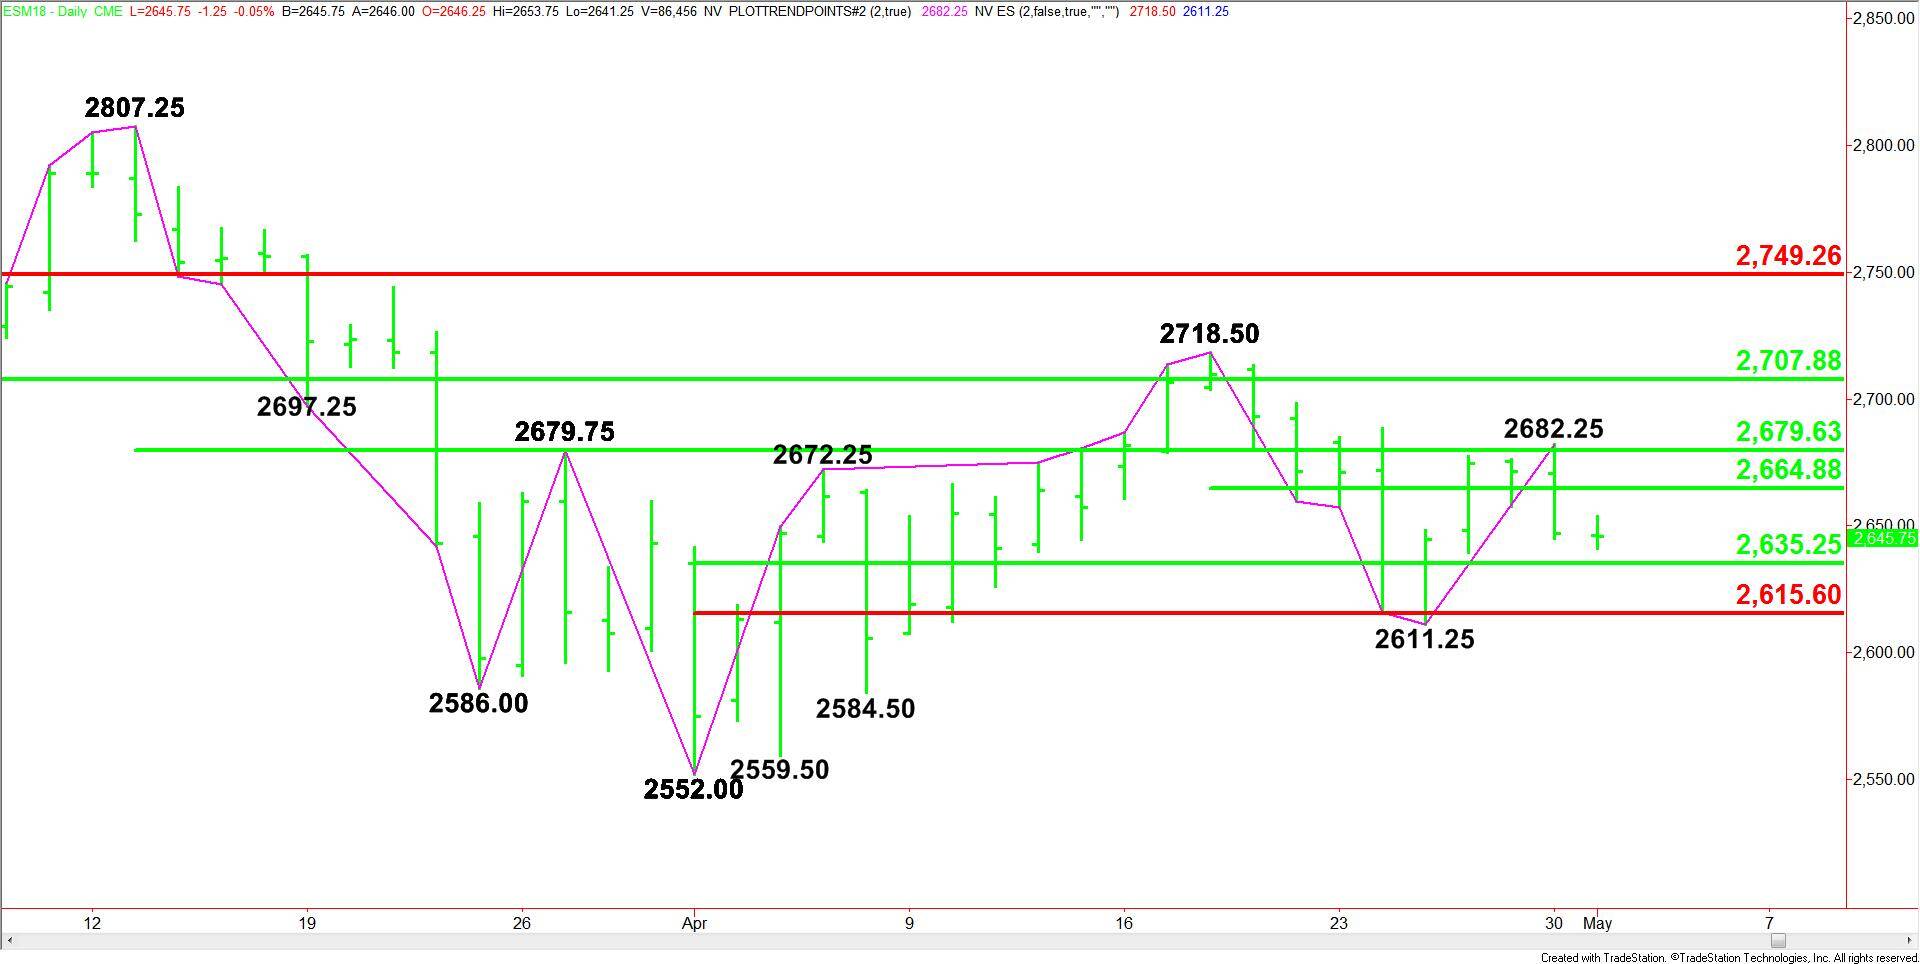
The main trend is up according to the daily swing chart, however, after forming a secondary higher bottom last week, the rally appears to be stalling.
A trade through 2611.25 will change the main trend to down. A move through 2682.25 will shift momentum back to the upside. A trade through 2718.50 will signal a resumption of the uptrend.
The price action is also being controlled by a number of retracement levels.
On the upside, resistance is being provided by 50% levels at 2665.00. 2679.75 and 2708.00.
The short-term range is 2552.00 to 2718.50. Its retracement zone at 2635.25 to 2615.50 is support.
Daily Swing Chart Technical Forecast
Based on the early trade and the downside momentum, the first target is the 50% level at 2635.25. Trader reaction to 2635.25 will determine the direction of the index today.
Holding above 2635.25 will signal the return of buyers. If this creates enough upside momentum, we could see a move into 2665.00, 2679.75 and 2682.25. The latter is the trigger point for an acceleration into 2708.00 then 2718.50.
Taking out 2635.25 with conviction could drive the index into 2615.50 to 2611.25. The daily chart is wide open to the downside under 2611.25 so don’t be surprised by an acceleration to the downside.