



June E-mini S&P 500 Index futures are expected to open the regular session higher based on the pre-market trade.
Daily Swing Chart Technical Analysis
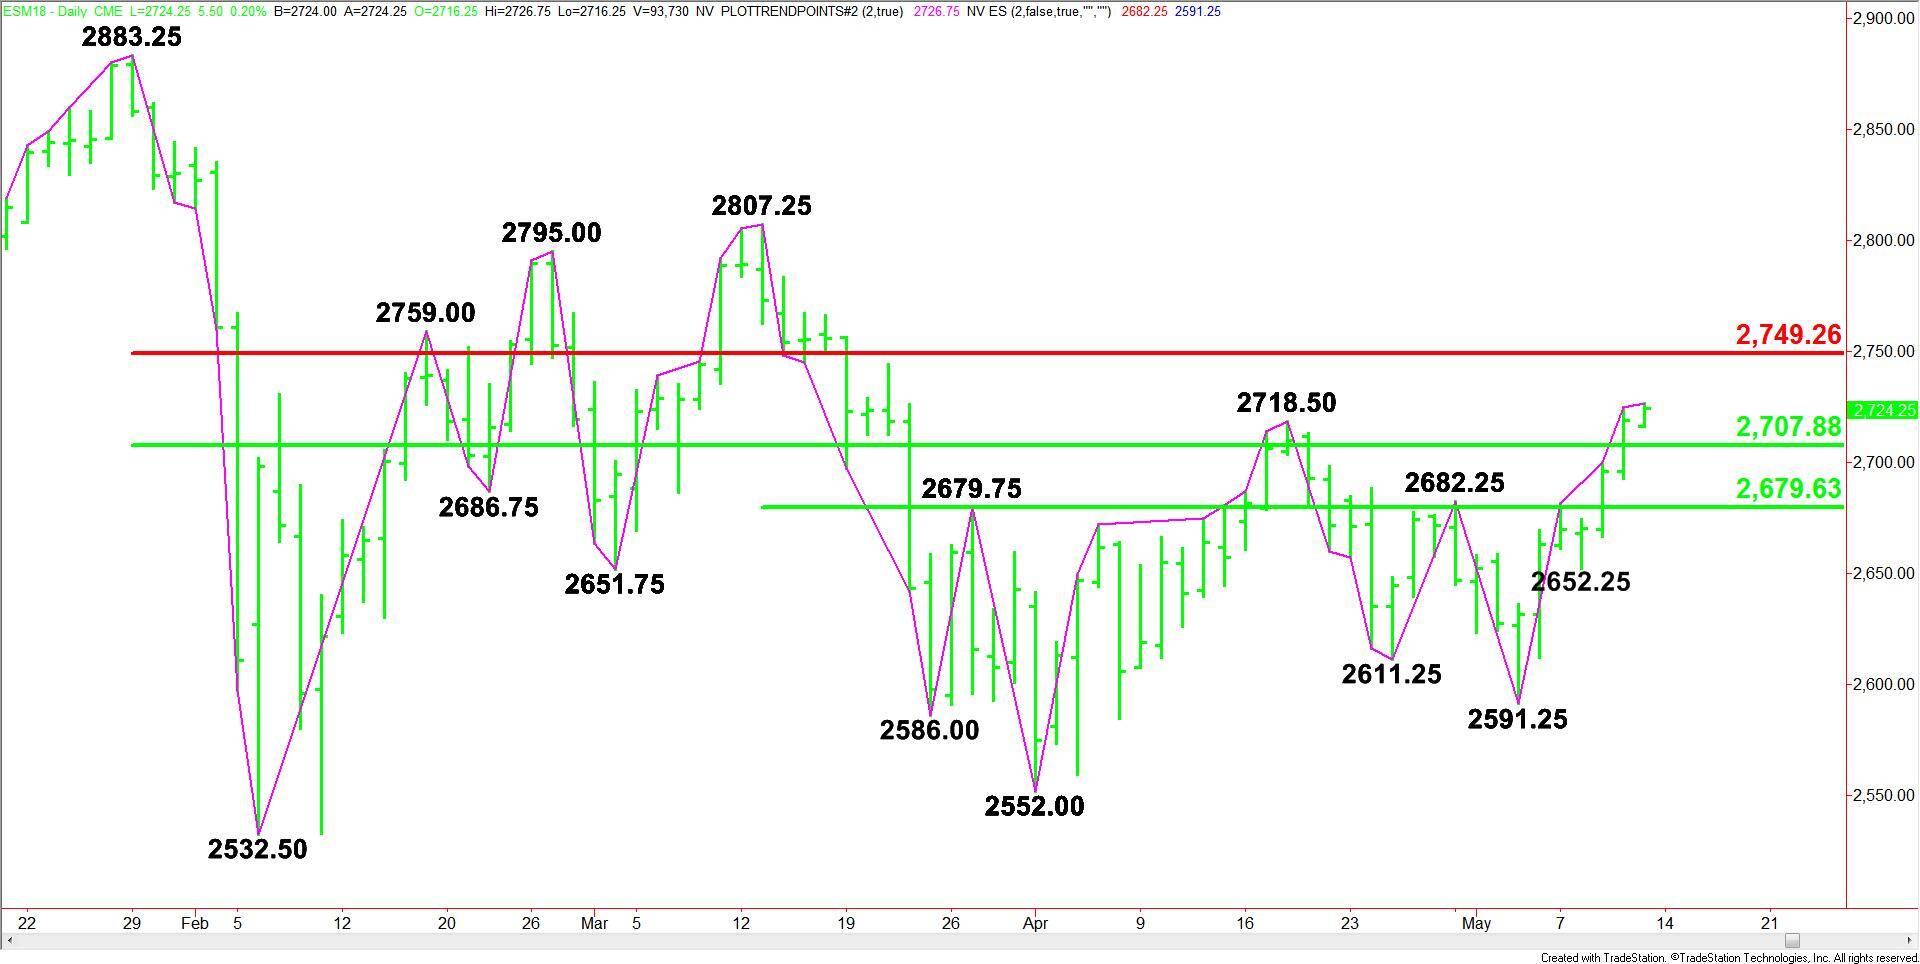
The main trend is up according to the daily swing chart. The uptrend was reaffirmed on Thursday when buyers took out a previous main top at 2718.50. The index is up six days from its last main bottom so we could see a closing price reversal top especially since the index is trading inside a major retracement zone.
The minor trend will change to down on a trade through 2652.25.
The main range is 2883.25 to 2532.50. Its retracement zone at 2707.75 to 2749.25 is currently being tested. Trader reaction to this zone will determine the longer-term direction of the index.
The short-term range is 2807.25 to 2552.00. Its 50% level or pivot at 2679.50 is support.
Daily Swing Chart Technical Forecast
Based on the early trade, the direction of the index today is likely to be determined by trader reaction to the main 50% level at 2707.75.
A sustained move over 2707.75 will indicate the presence of buyers. If the current upside momentum continues, we could see a drive into the Fibonacci level at 2749.25. We could see a technical bounce on the first test of this level. However, it is also the trigger point for an acceleration to the upside.
The daily chart shows there is plenty of room to the upside over 2749.25 with 2807.25 the next major upside target.
The first sign of weakness will be a break under 2718.50. This could drive the index into 2707.75. Crossing to the weak side of this level will indicate the return of sellers. This could trigger an acceleration to the downside with the next target 2679.50.