



June E-mini S&P 500 Index futures are expected to open lower based on the pre-market trade.
Daily Swing Chart Technical Analysis
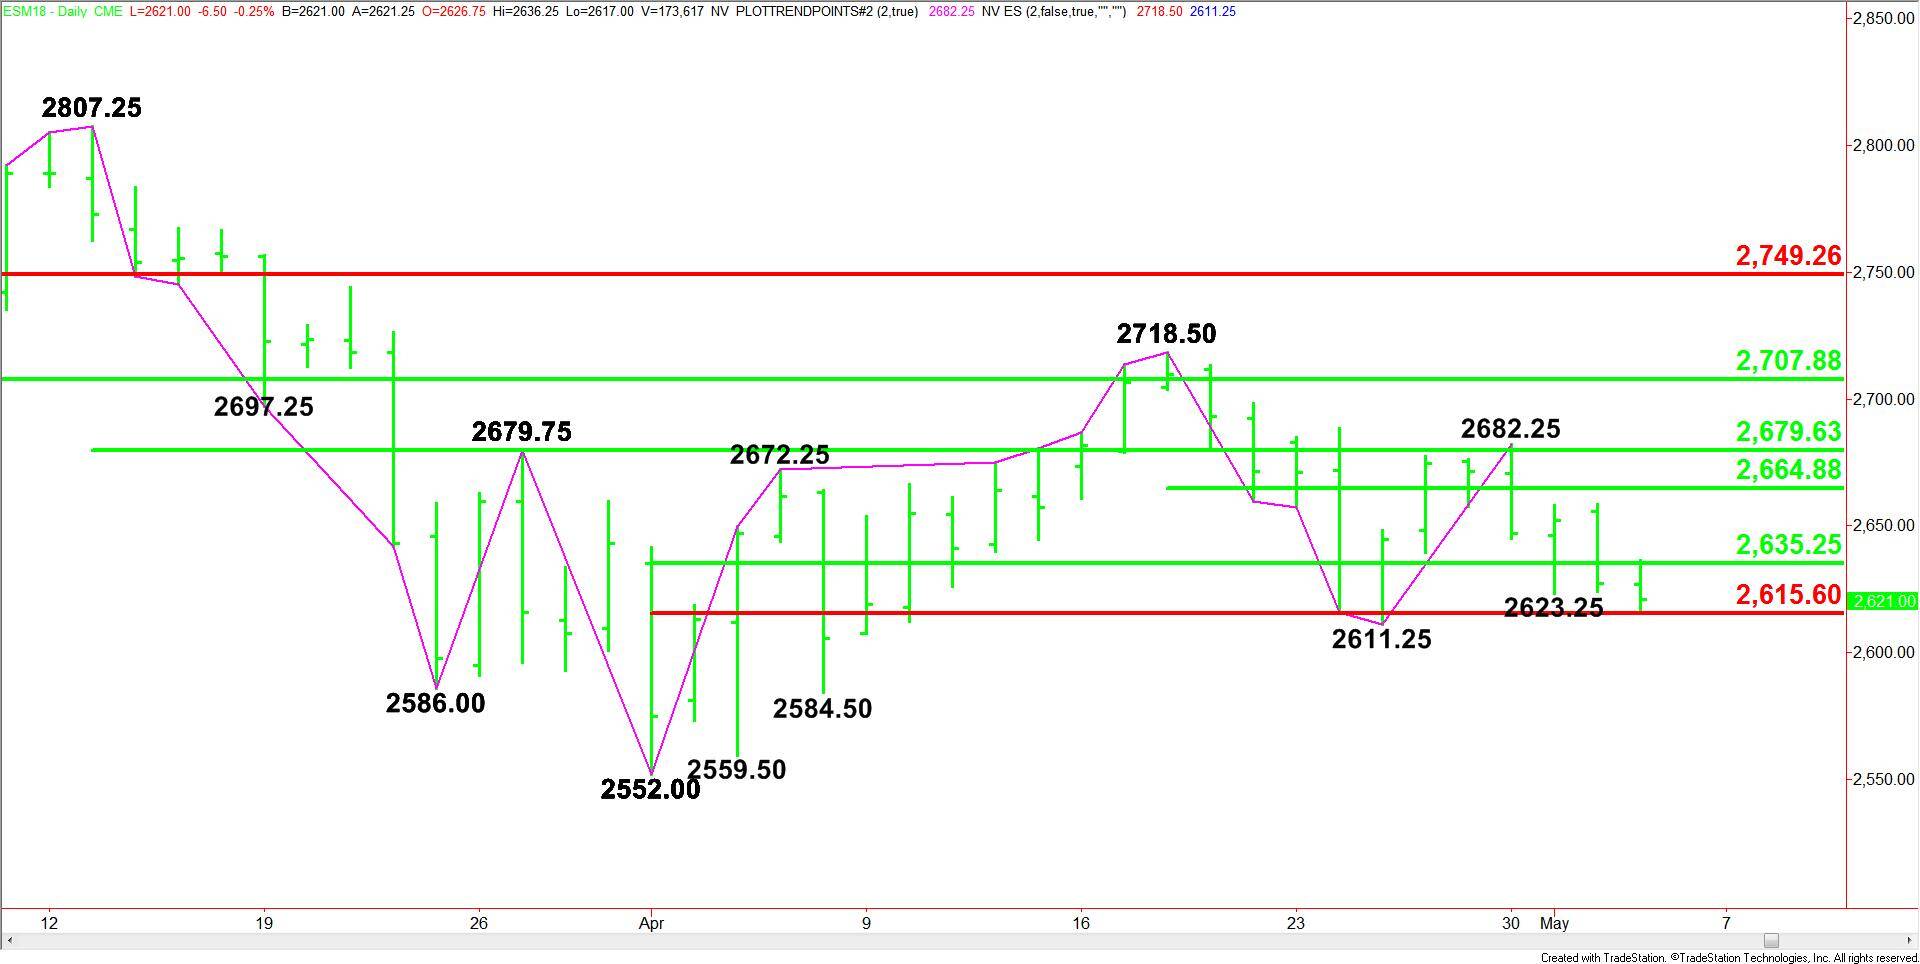
The main trend is up according to the daily swing chart. However, momentum is trending lower. The minor trend is down. The main trend will turn down on a trade through 2611.25. A move through 2682.25 will signal a resumption of the uptrend.
The intermediate range is 2552.00 to 2718.50. The index is currently straddling its retracement zone at 2635.25 to 2615.50. This zone is controlling the near-term direction of the index.
On the upside, potential resistance are 50% levels at 2665.00 to 2679.75.
Daily Swing Chart Technical Forecast
Based on the early trade, the direction of the index the rest of the session is likely to be determined by trader reaction to the 50% level at 2635.25.
A sustained move under 2635.25 will signal the presence of sellers. This could drive the index into the Fibonacci level at 2615.50. Taking out this level will indicate the selling is getting stronger. This could trigger a move into the main bottom at 2611.25.
A trade through 2611.25 will not only change the main trend to down, but it could also trigger an acceleration to the downside with potential targets coming in at 2584.50, 2559.50 and 2552.00.
A sustained move over 2635.25 will signal the presence of buyers. If this move gains traction then look for the rally to extend into the next 50% level at 2665.00, followed by another 50% level into 2679.75 and the main top at 2682.25.
Basically, I’m look for an upside bias to develop on a sustained move over 2635.25 and for a downside bias to develop on a sustained move under 2615.50.