



June E-mini S&P 500 Index futures are trading slightly lower shortly before today’s U.S. Non-Farm Payrolls report. Trader indecision is helping to hold the index inside yesterday’s range. However, it also indicates impending volatility especially given yesterday’s impressive reversal to the upside.
Daily Swing Chart Technical Analysis
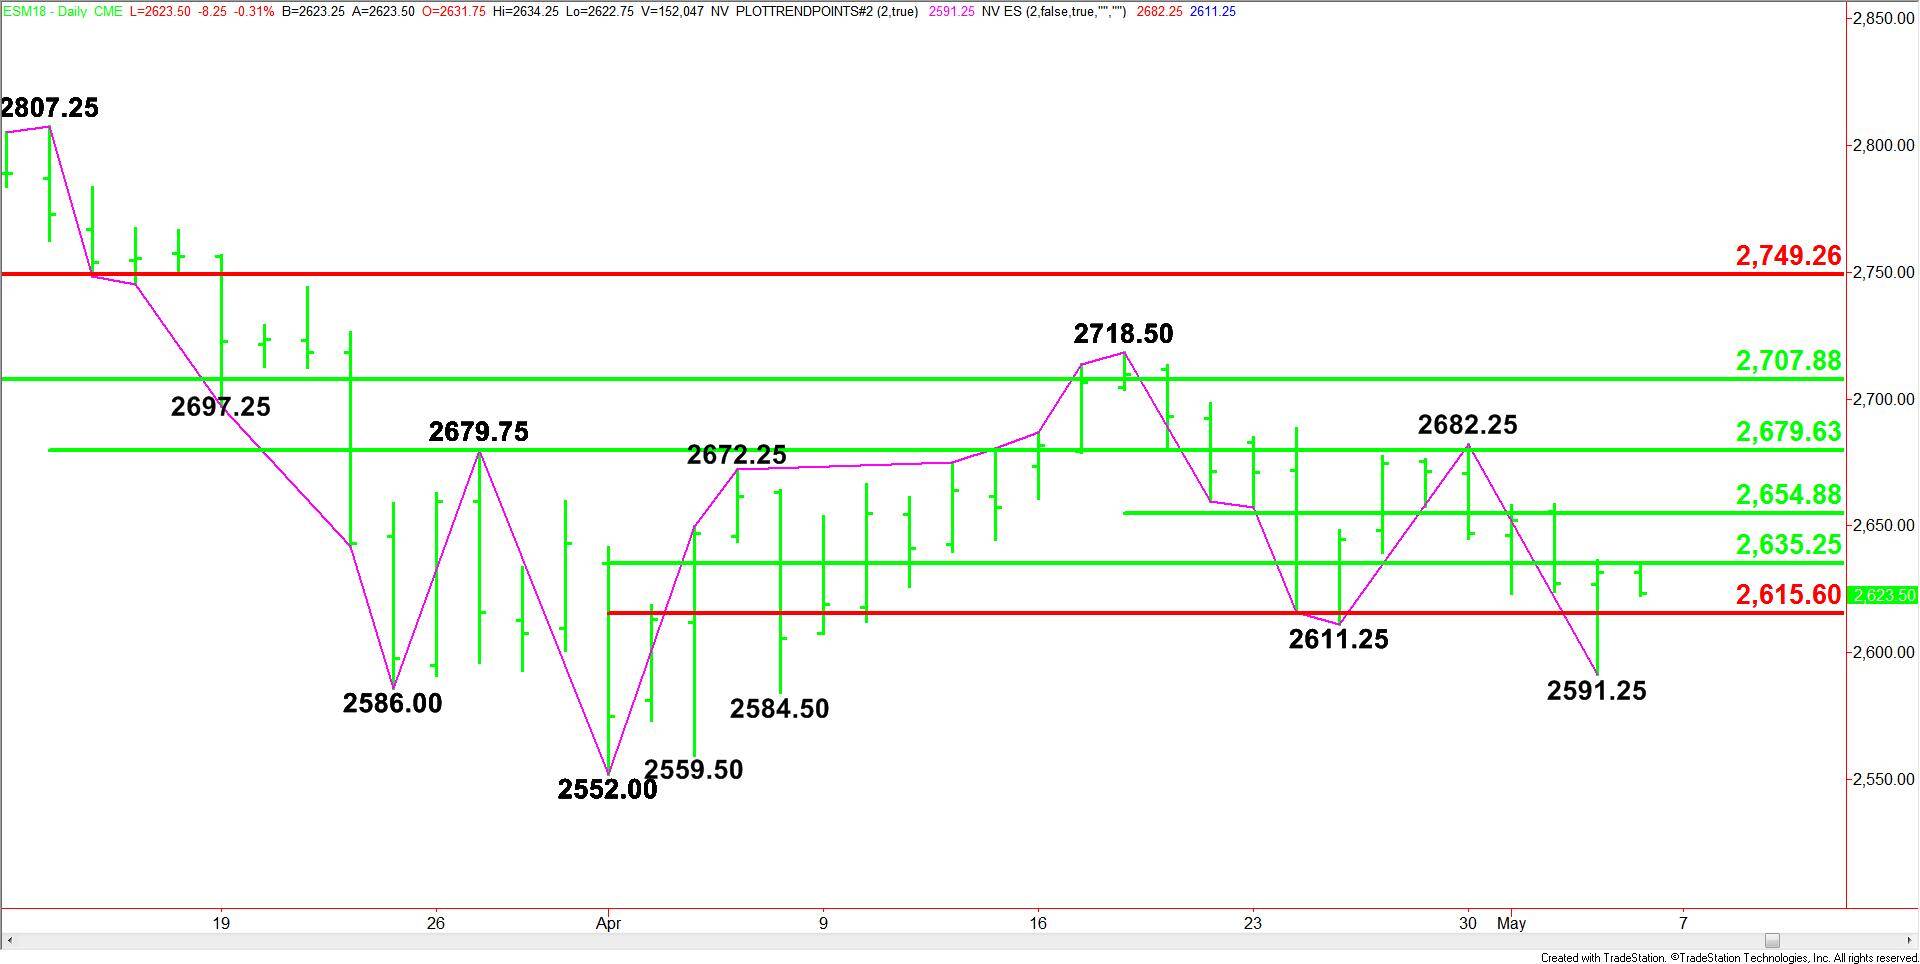
The main trend is down according to the daily swing chart. However, momentum may shift to the upside on a move through yesterday’s high at 2636.25. The main trend will change to up on a trade through 2682.25.
The price action is also being controlled by a series of retracement levels.
The intermediate range is 2552.00 to 2718.50. Its retracement zone at 2635.25 to 2615.50 is currently being tested.
The short-term range is 2682.25 to 2591.25. Its 50% level or pivot is 2655.00.
The main range is 2807.25 to 2552.00. Its 50% level at 2679.75 is today’s primary upside target.
Daily Swing Chart Technical Forecast
Based on the early price action, the direction of the index today is likely to be determined by trader reaction to the 50% level at 2635.25.
A sustained move under 2635.25 will indicate the presence of sellers. This could drive the index into the Fib level at 2615.50.
A sustained move under 2615.50 will indicate the selling pressure is getting stronger. This could trigger a break into yesterday’s low at 2591.25. This price is the trigger point for an extension of the selling into lows at 2584.50, 2559.50 and 2552.00.
Overtaking and sustaining a move over 2635.25 will signal the presence of buyers. This could trigger a surge into 2655.00, followed by a possible resistance cluster at 2679.75 to 2682.25. The latter is the trigger point for an acceleration to the upside.