



June E-mini S&P 500 Index futures finished lower on Wednesday. Fear of a recession encouraged investors to pair positions. The catalyst behind increasing worries about a recession is the plunge in 10-year U.S. Treasury yields and an inverted yield curve. According to Reuters, the U.S. Treasury yield curve has inverted before each recession in the past 50 years and has only offered a false signal just once in that time.
On Wednesday, June E-mini S&P 500 Index futures settled at 2807.25, down 3.25 or -0.12%.
Daily Swing Chart Technical Analysis
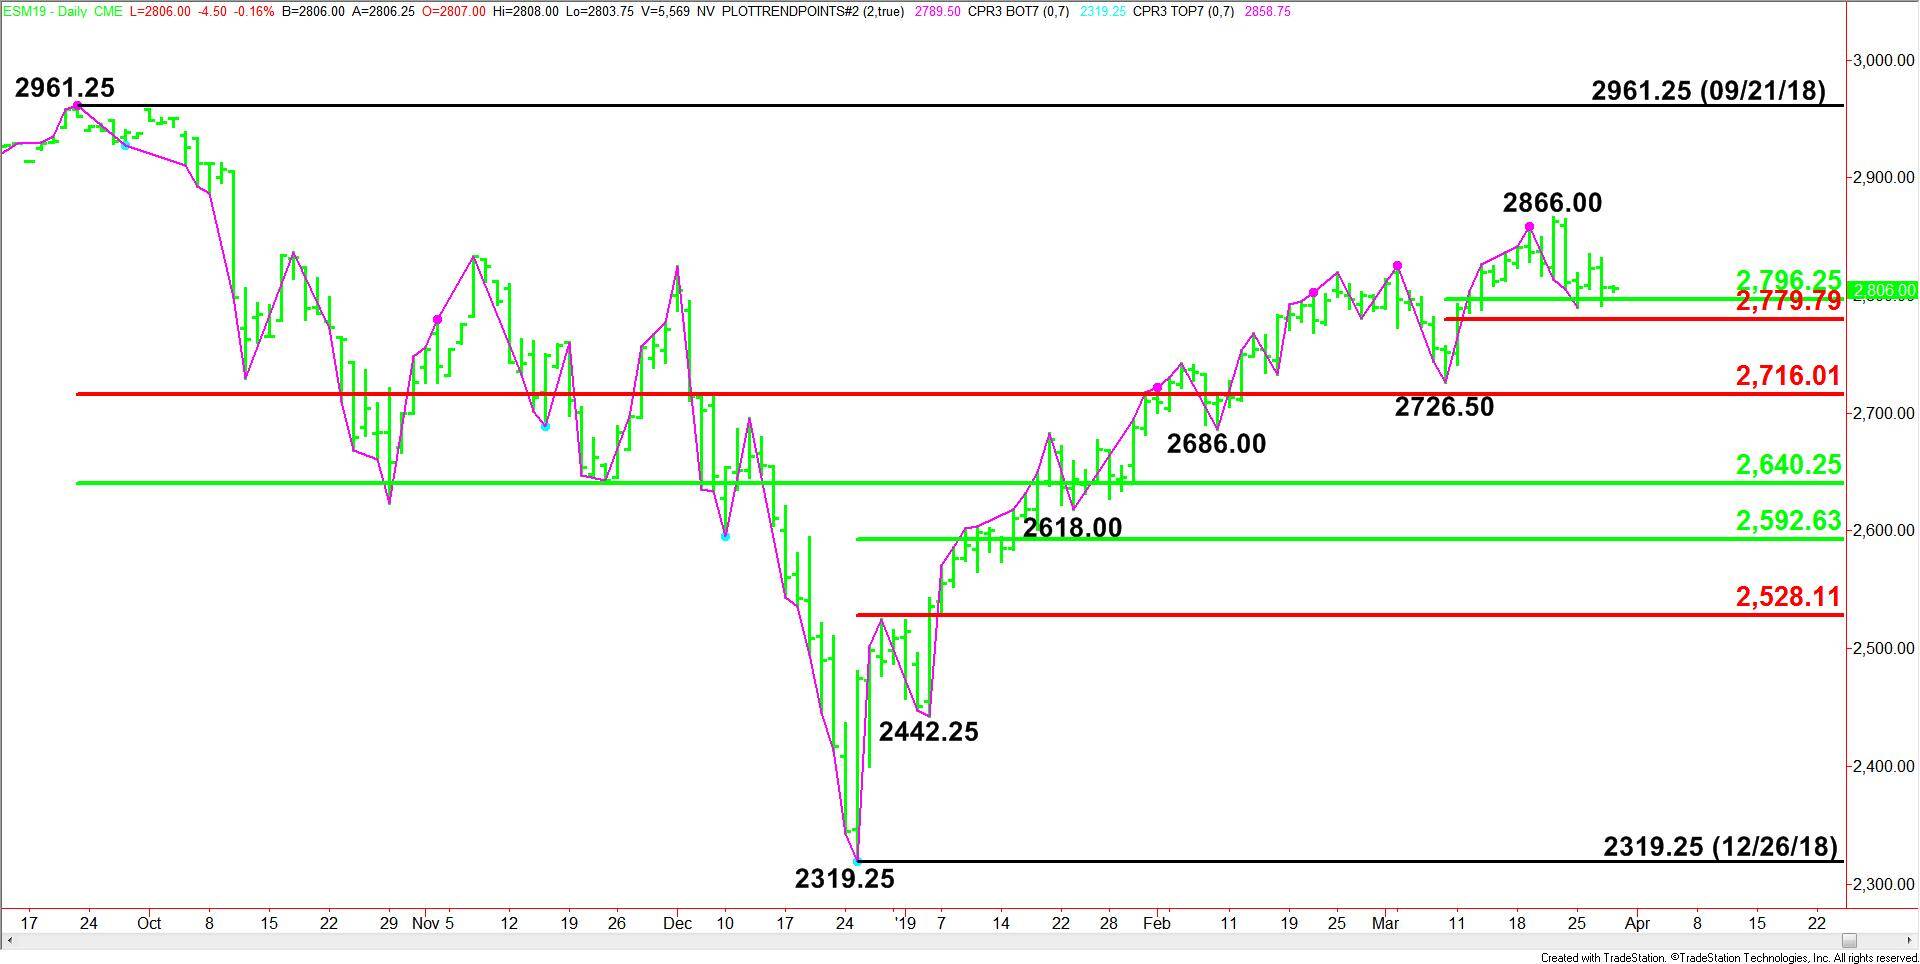
The main trend is up according to the daily swing chart. However, momentum is trending lower. A trade through 2866.00 will signal a resumption of the uptrend. A move through 2726.50 will change the main trend to down.
The minor trend is down. This move shifted momentum to the downside. A trade through 2835.00 will turn the main trend up. This will also shift momentum back to the upside.
The short-term range is 2726.50 to 2866.00. Its retracement zone at 2796.25 to 2779.75 is providing support.
The contract range is the September 21, 2018 main top at 2961.25 and the December 26, 2018 main bottom at 2319.25. Its retracement zone at 2716.00 to 2640.25 is support. Holding above this zone is helping to generate an upside bias.
The main range is the December 26, 2018 main bottom and the March 21, 2019 main top at 2866.00. If 2640.25 fails as support then look for the selling to extend into its retracement zone at 2592.50 to 2528.00.
Daily Swing Chart Technical Forecast
Based on the recent price action, the short-term direction of the June E-mini S&P 500 Index is likely to be determined by trader reaction to the short-term retracement zone at 2796.25 to 2779.75.
A sustained move over 2796.25 will indicate the presence of buyers. A sustained move under 2779.75 will signal the presence of sellers.
If holding above 2796.25 generates enough upside momentum then look for a potential surge into 2866.00. Taking out this top will indicate the buying is getting stronger. This could trigger an acceleration to the upside with 2961.25 the next major upside target.
If 2779.75 fails as support then look for a potential acceleration to the downside with the next major targets the main bottom at 2726.50 and the major Fibonacci level at 2716.00.