



June E-mini S&P 500 Index futures are trying to hang on to their earlier gains late in the session. Earlier the index popped to 2679.75, following through to the upside after yesterday’s strong surge. Selling pressure started to build as the NASDAQ turned lower.
The main trend is down according to the daily swing chart. Today’s early strength helped make 2586.00 a new main bottom. A trade through this level will signal a resumption of the downtrend. The index will have to claw through a number of retracement levels before even coming close to changing the main trend to up.
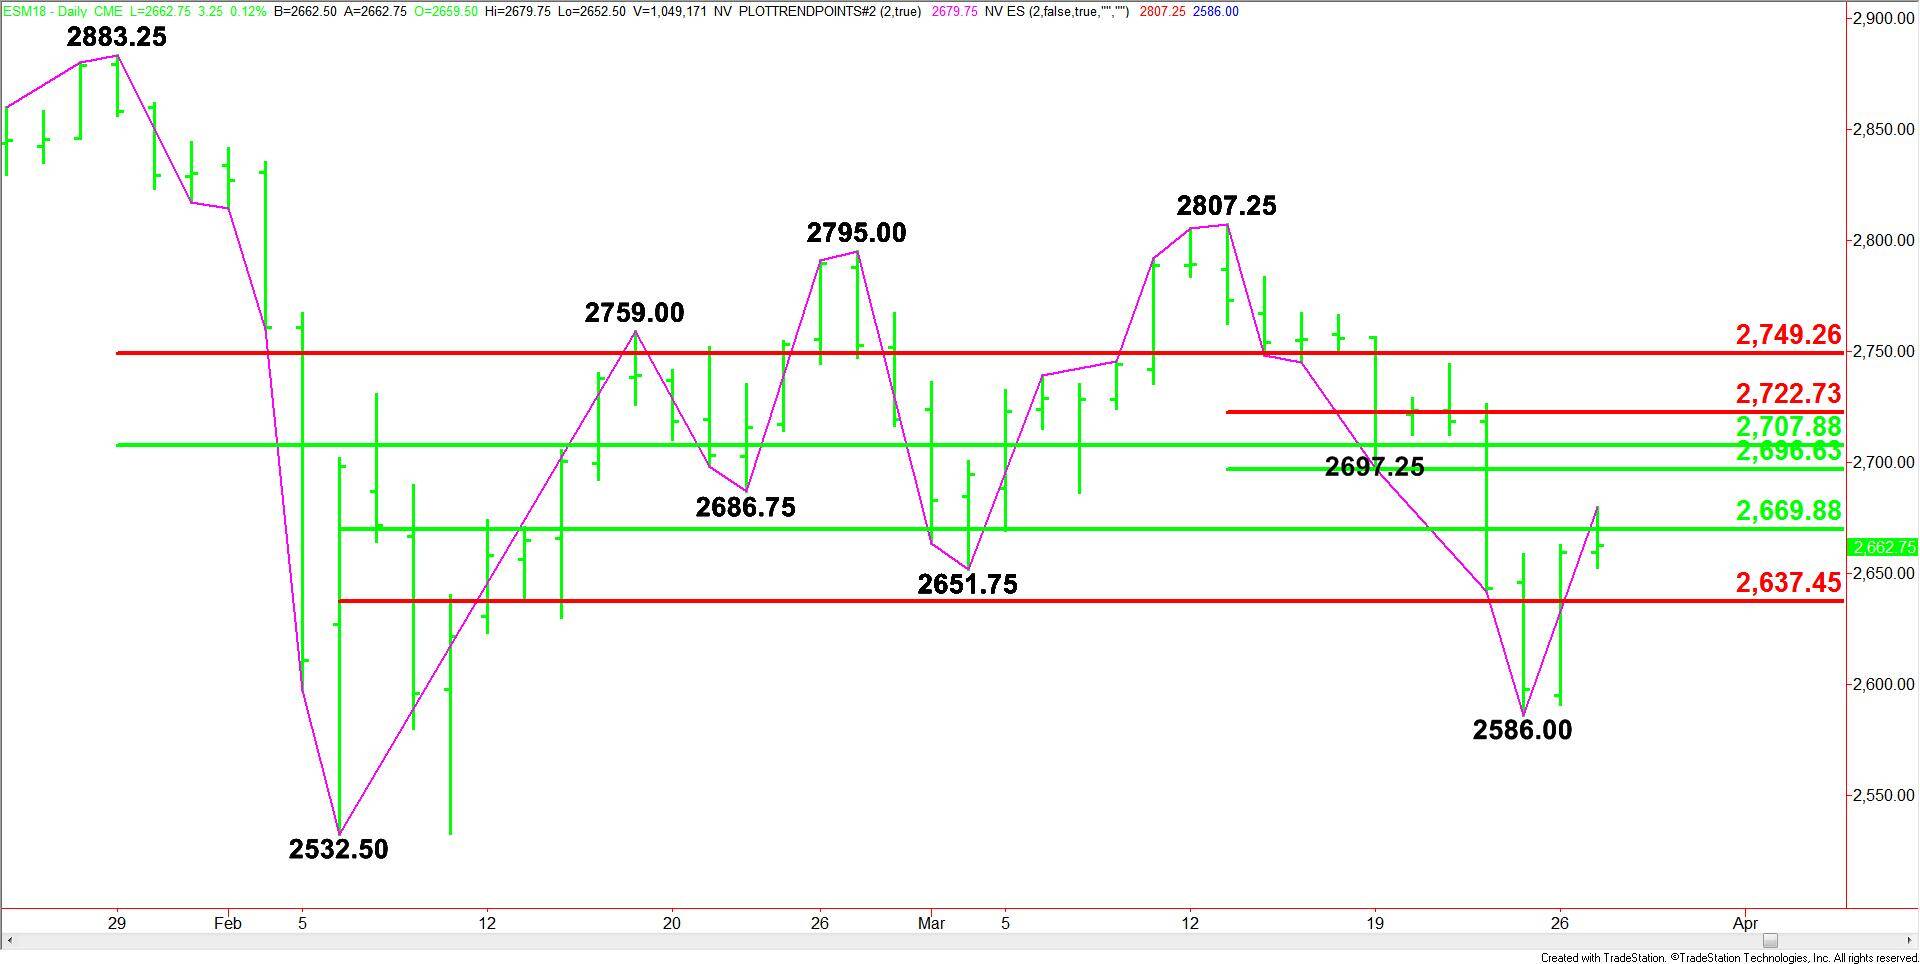
The main trend is 2883.25 to 2532.50. Its retracement zone at 2708.00 to 2749.25 is the primary upside target. Since the main trend is down, sellers are likely to come in on a test of this zone.
The intermediate trend is 2532.50 to 2807.25. Its retracement zone at 2637.50 to 2669.00 is currently being tested. The market will have to clear this zone in order to move to the next level.
The short-term range is 2807.25 to 2586.00. Its retracement zone at 2696.75 to 2722.75 is another upside target. It currently straddles the main 50% level at 2708.00.
The daily chart indicates the rest upside target is the cluster of levels at 2698.75 to 2722.75 with 2708.00 in between.
The direction of the index into the close is likely to be determined by trader reaction to the 50% level at 2670.00.
A sustained move over 2670.00 will give investors the opportunity to drive the market into 2696.75 to 2708.00.
A sustained move under 2670.00 could drive the index into 2637.50.