



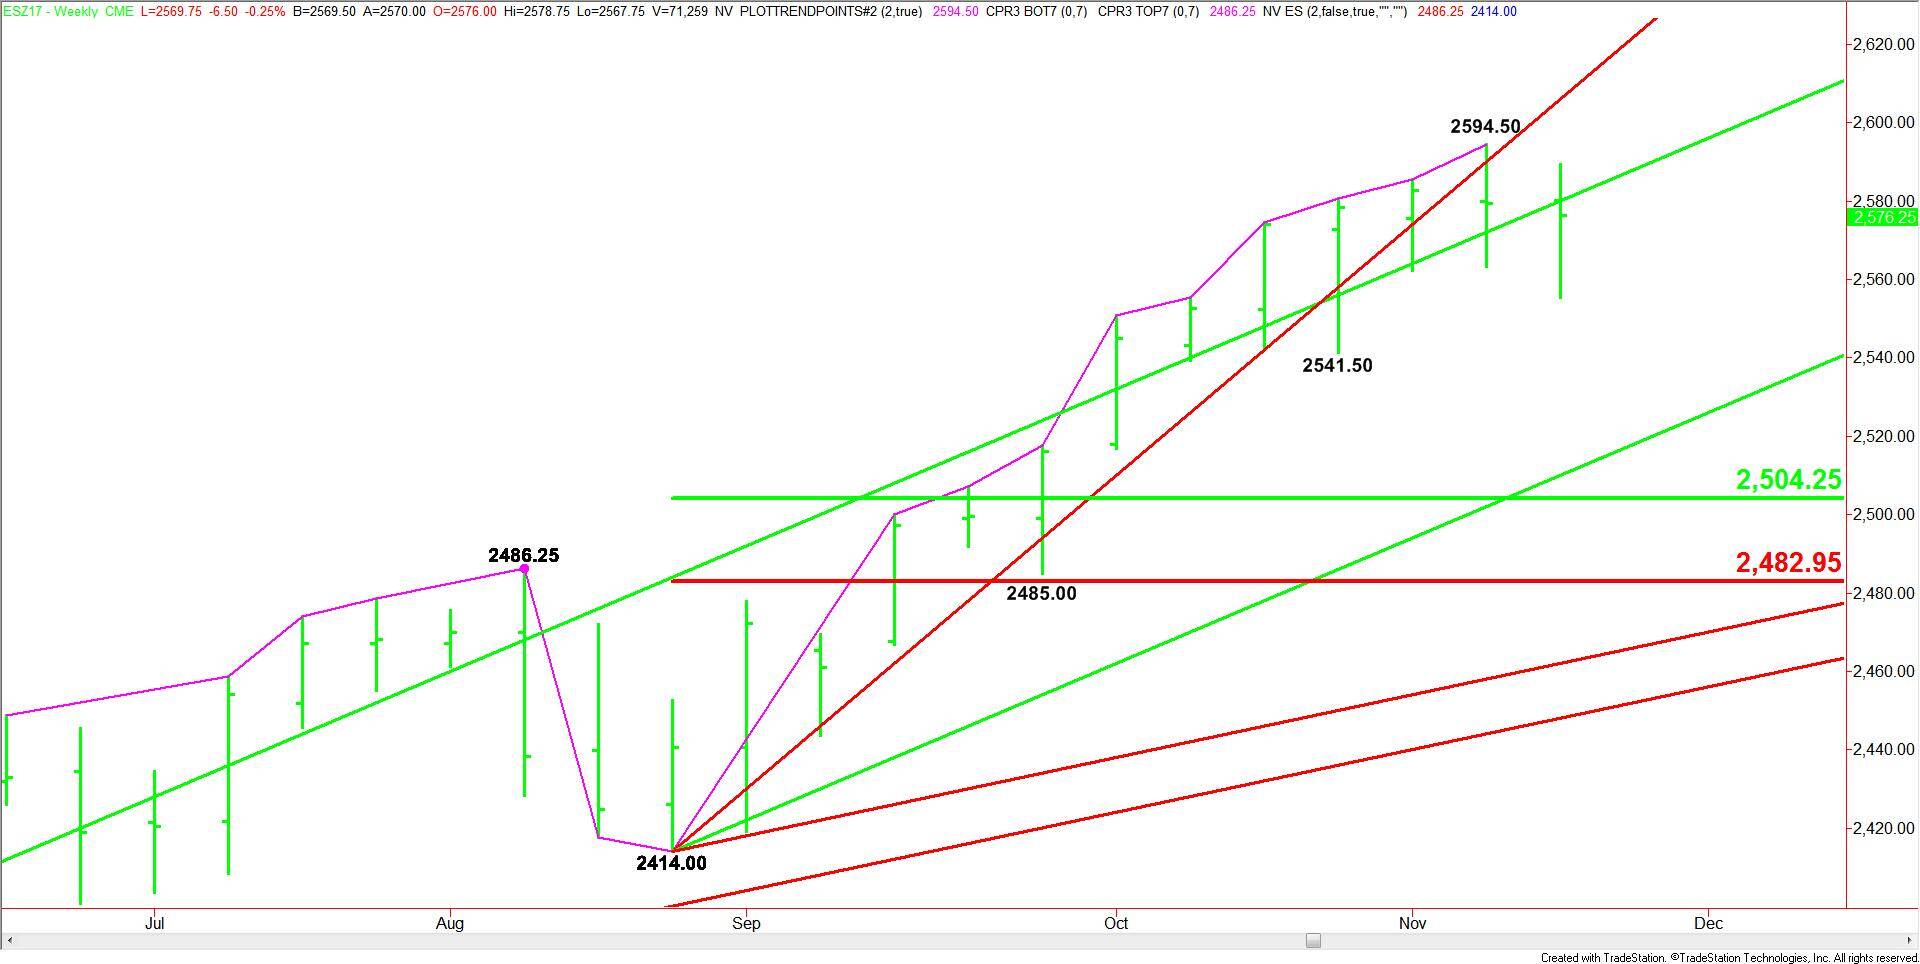
December E-mini S&P 500 Index futures closed lower last week after confirming the previous week’s potentially bearish closing price reversal top. The chart pattern isn’t signaling a change in trend, but it is indicating that the selling is greater than the buying at current price levels.
Weekly Technical Analysis
The main trend is up according to the weekly swing chart. A trade through 2594.50 will negate the chart pattern and signal a resumption of the uptrend.
A trade through 2555.50 will indicate the selling is getting stronger. A trade through 2541.50 will change the minor trend to down.
The main range is 2414.00 to 2594.50. If 2541.50 is taken out with conviction then look for the selling to extend into its retracement zone at 2504.25 to 2483.00.
Weekly Technical Forecast
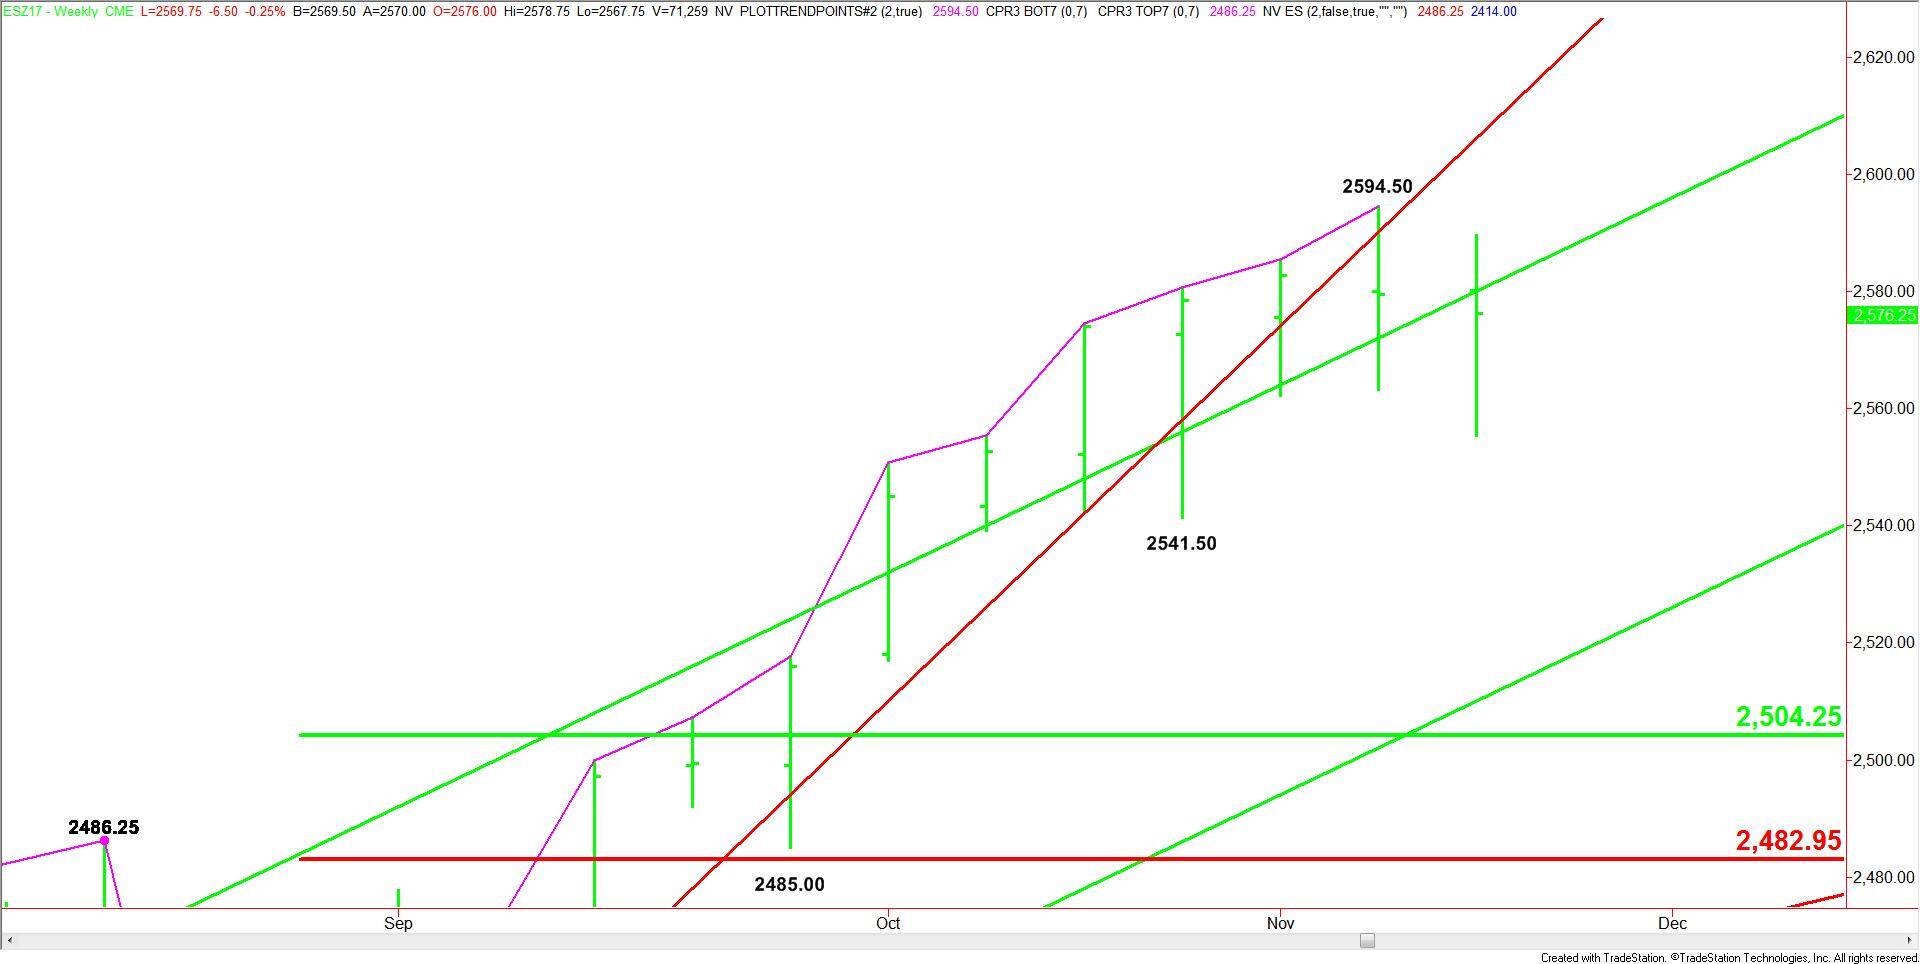
Based on last week’s close at 2576.25 and the price action, the direction of the index today is likely to be determined by trader reaction to the uptrending angle at 2588.00.
Overtaking 2588.00 and sustaining the rally will indicate the return of buyers. If this move generates enough upside momentum then look for a test of the all-time high at 2594.50.
Taking out 2594.50 could trigger a rally into a steep uptrending angle at 26222. Crossing to the strong side of this angle will put the index in an extremely strong position.
A sustained move under 2588.00 will signal the presence of sellers. The daily chart is open to 2541.50. If this price is taken out with rising volume then look for the selling to extend into the next major uptrending angle at 2518.00. This is followed closely by the 2504.25 to 2483.00 retracement zone.
Be careful buying strength and selling weakness because of the light holiday volume.