


Record High Breakout Builds Ahead of Earnings
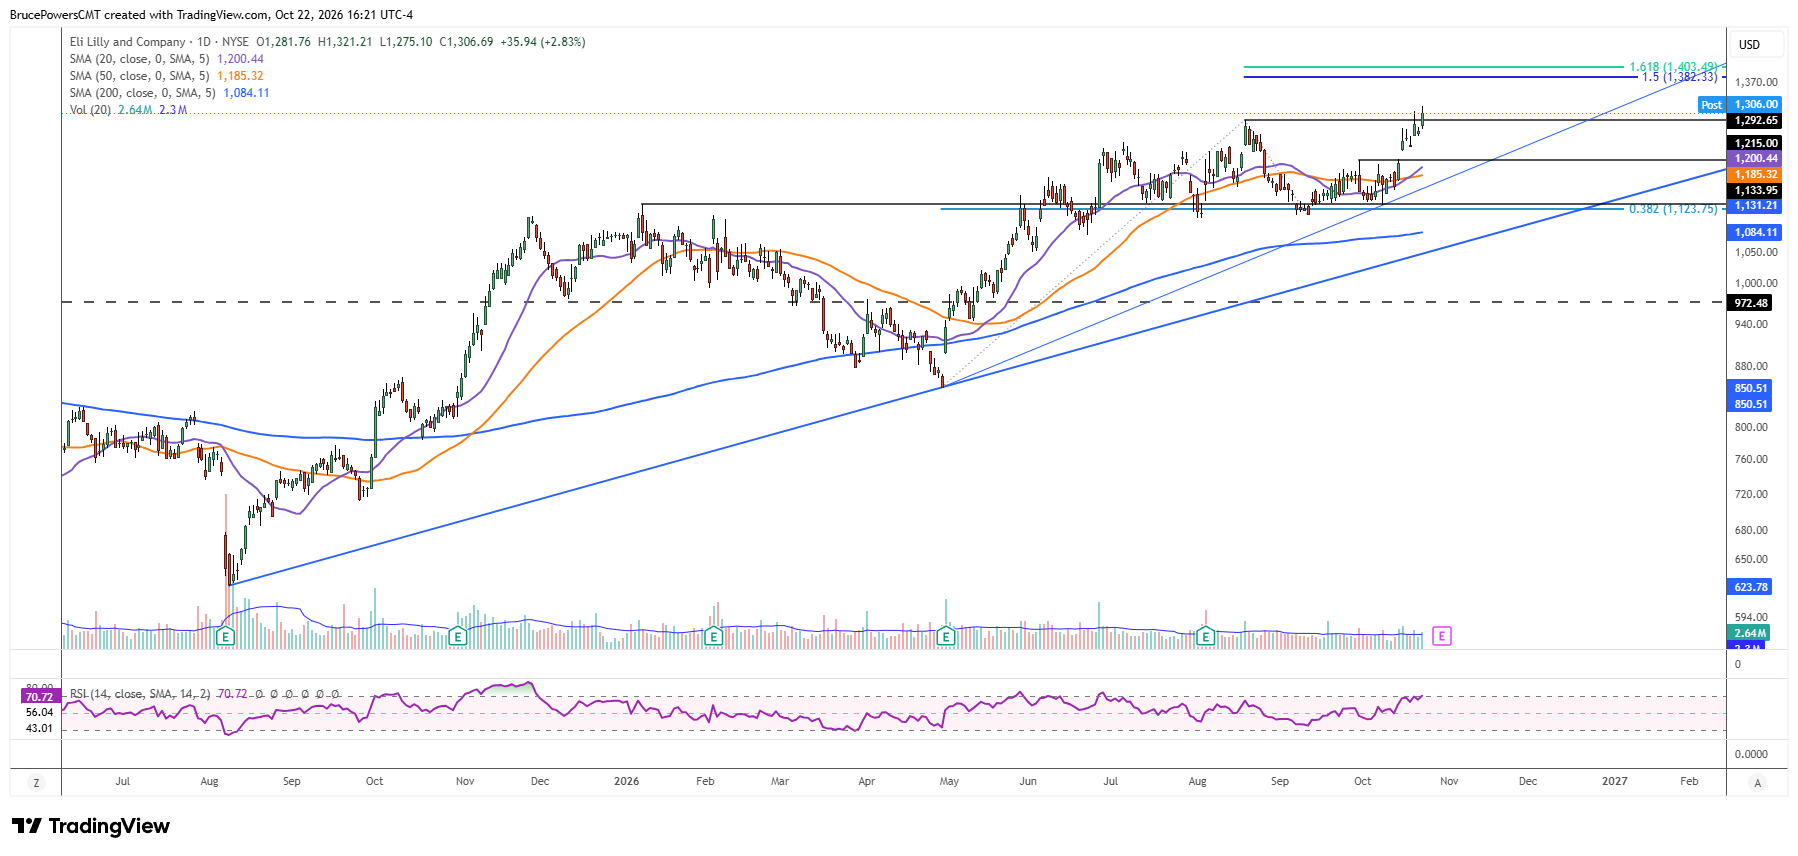
Eli Lilly and Company (LLY), a major American multinational pharmaceutical company, is set to report its Q3 2026 results before the market opens in one week, on October 29. Ahead of the report, its stock extended its long-term bullish trend to a new record high of $1,321 this week, with the breakout confirmed by a daily close above the prior high of $1,293 on Thursday. A weekly close above that level would confirm the breakout on the higher timeframe and may strengthen the case for further upside.
Pullback Reinforces Bullish Trend Structure
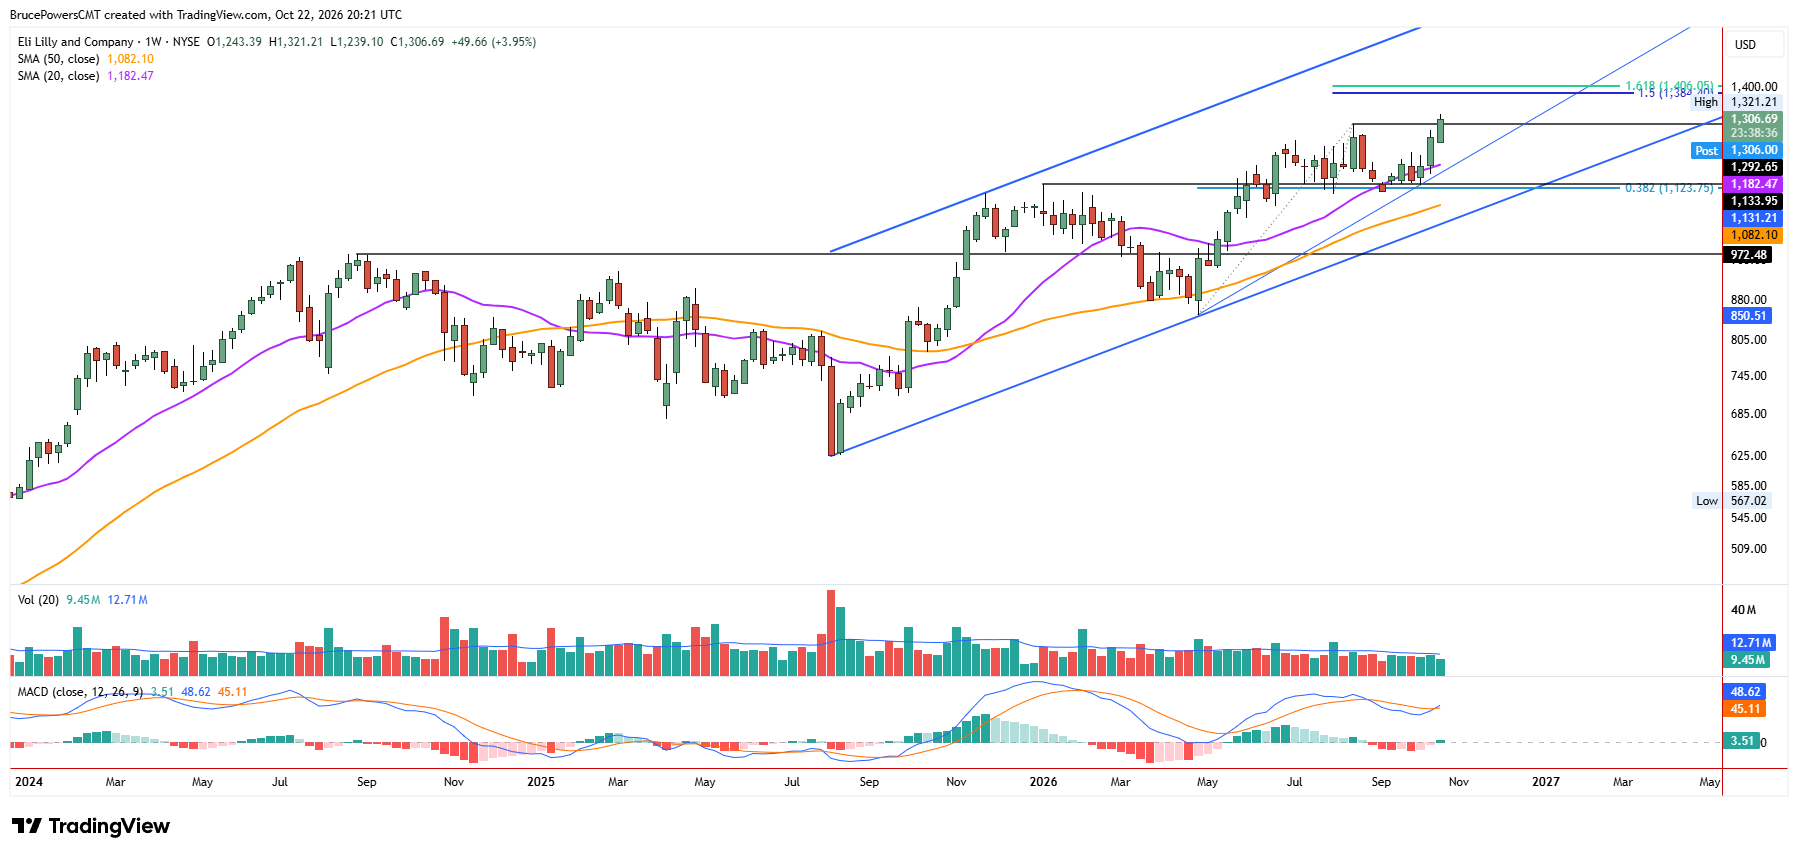
The advance to new highs follows a corrective pullback that completed a 38.2% Fibonacci retracement of the prior advance at $1,124 and established a higher swing low at $1,113, now a key part of the bullish trend structure. Moreover, the correction successfully tested weekly dynamic support near the 20-week moving average, which now stands near $1,183. The previous pullback, following the January high, found support near the 50-week moving average. Finding support near the 20-week moving average during the latest correction suggests improving underlying bullish momentum, as buyers defended a shorter-term trend reference.
Key Support Levels Define Pullback Risk
Although LLY is extended in the short term, the new bullish signal may be followed by a pullback or consolidation, potentially creating new opportunities. Key support levels include this week’s higher weekly low of $1,239 and September’s high of $1,215. The rising 20-day moving average near $1,201 may soon move above September’s high, adding another layer of potential dynamic support. Additionally, the 20-day moving average recently crossed above the 50-day moving average, reinforcing the improving bullish momentum.
$1,406 Becomes a Potential Upside Target
With LLY now at record highs, the next question is how far the breakout could extend. The two previous trend breakouts in LLY found resistance near the 161.8% Fibonacci extension of the prior decline and a 150% extension, respectively. This suggests a potential upside target zone between the 150% extension of the recent decline at $1,384 and the 161.8% extension of the same decline at $1,406. While the stock may consolidate or pull back after its recent advance, the bullish structure remains intact. A weekly close above $1,293 would add higher-timeframe confirmation, keeping the focus on the $1,384-$1,406 target zone as the next potential test of the ongoing trend.