


Ethereum (ETH) has bounced off its 200-day exponential moving average (EMA) in the past couple of days ahead of the Fed’s interest rate decision today.
Analysts surveyed by FedWatch don’t expect that the Federal Open Market Committee (FOMC) will hike rates this time, even though inflation surpassed the market’s estimates in September.
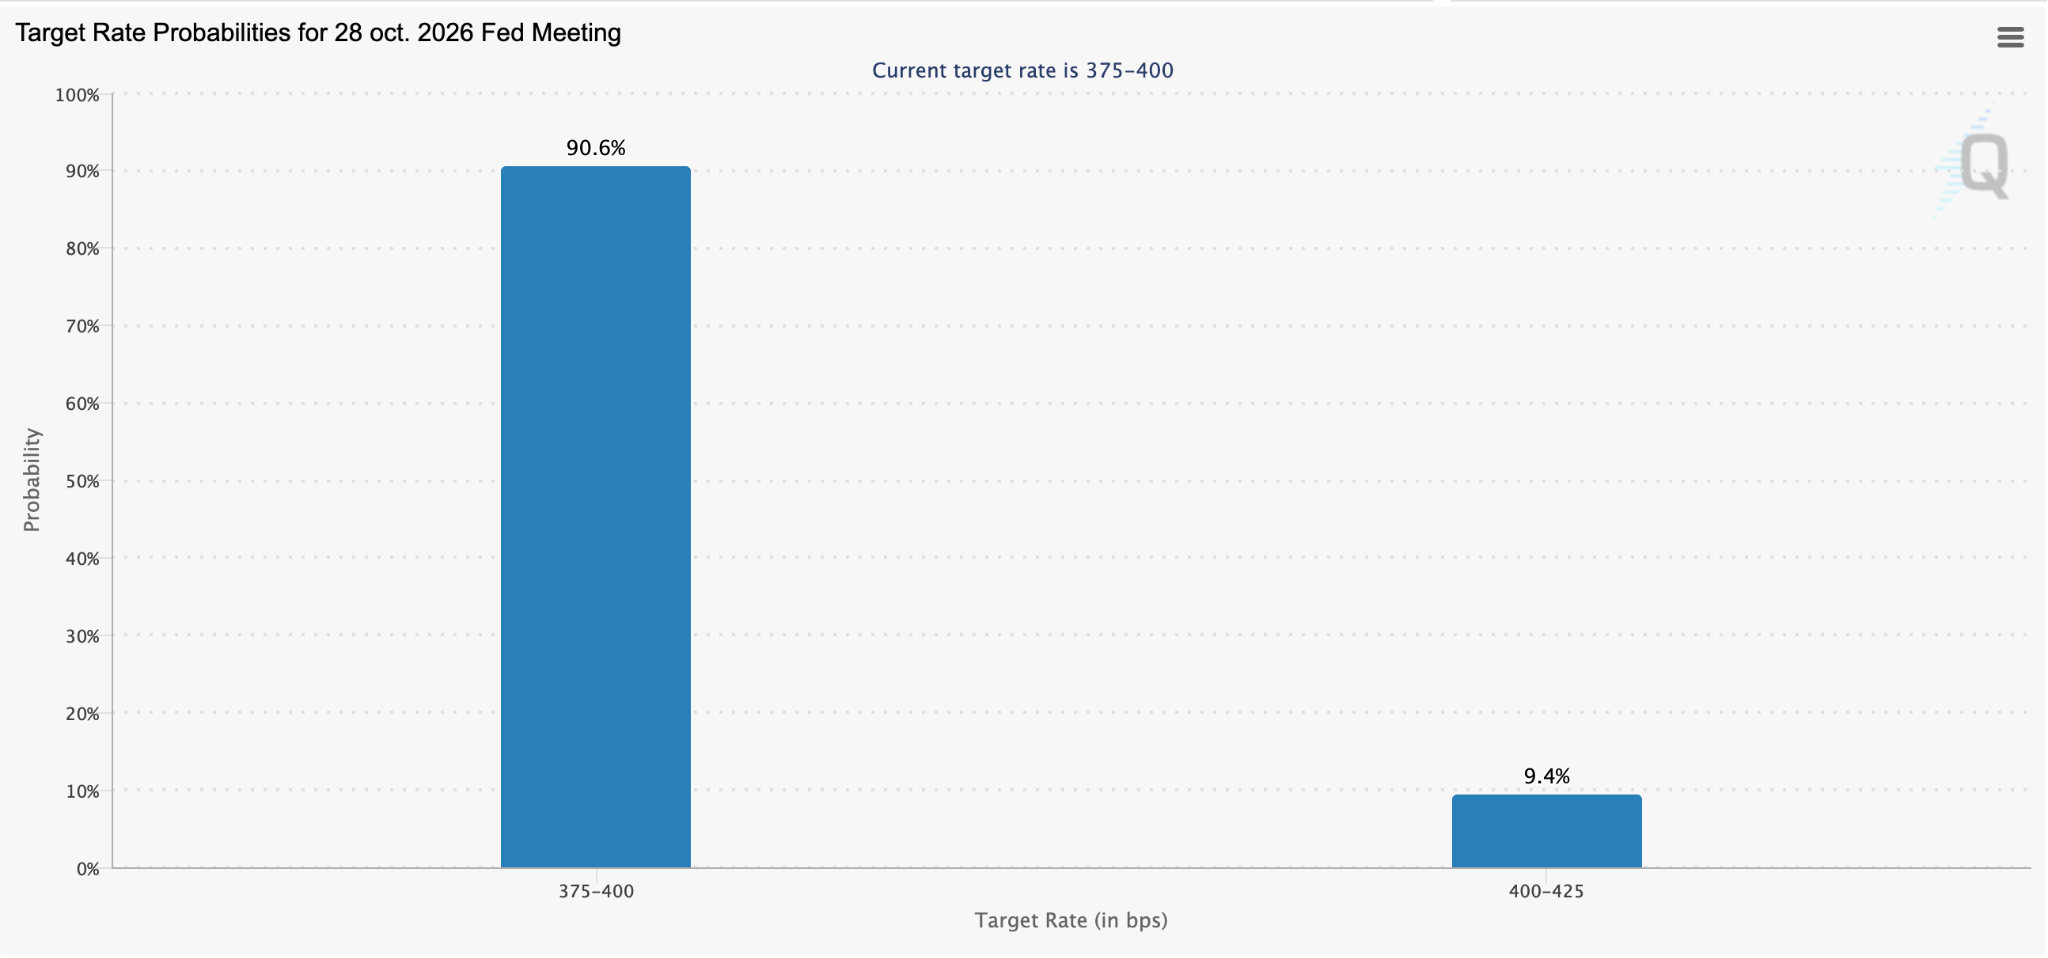
Officials may be adopting a “wait and see” approach, as they analyze the impact that the previous hike could have on prices in the United States.
However, as the situation in the Middle East remains tense and oil prices sit above $100, it is not impossible that the Committee may deem a premature rate increase necessary.
If that’s the case, it would be a surprise for the crypto market, and it could prompt a massive sell-off. Although this is not the most likely scenario, it can’t be entirely discarded.
Meanwhile, we continue to expect the official dates for the rollout of the Glamsterdam upgrade for Ethereum.
Historical Patterns Suggest that ETH May Need to Drop to $1,970 Before Resuming Its Uptrend
As we have commented in previous price prediction articles, the Pectra upgrade managed to catalyze a strong move for ETH back in May 2025, pushing the token out of bearish territory entirely.
Looking at the weekly chart for ETH, we can see the uncanny similarities between the price action back then and now.
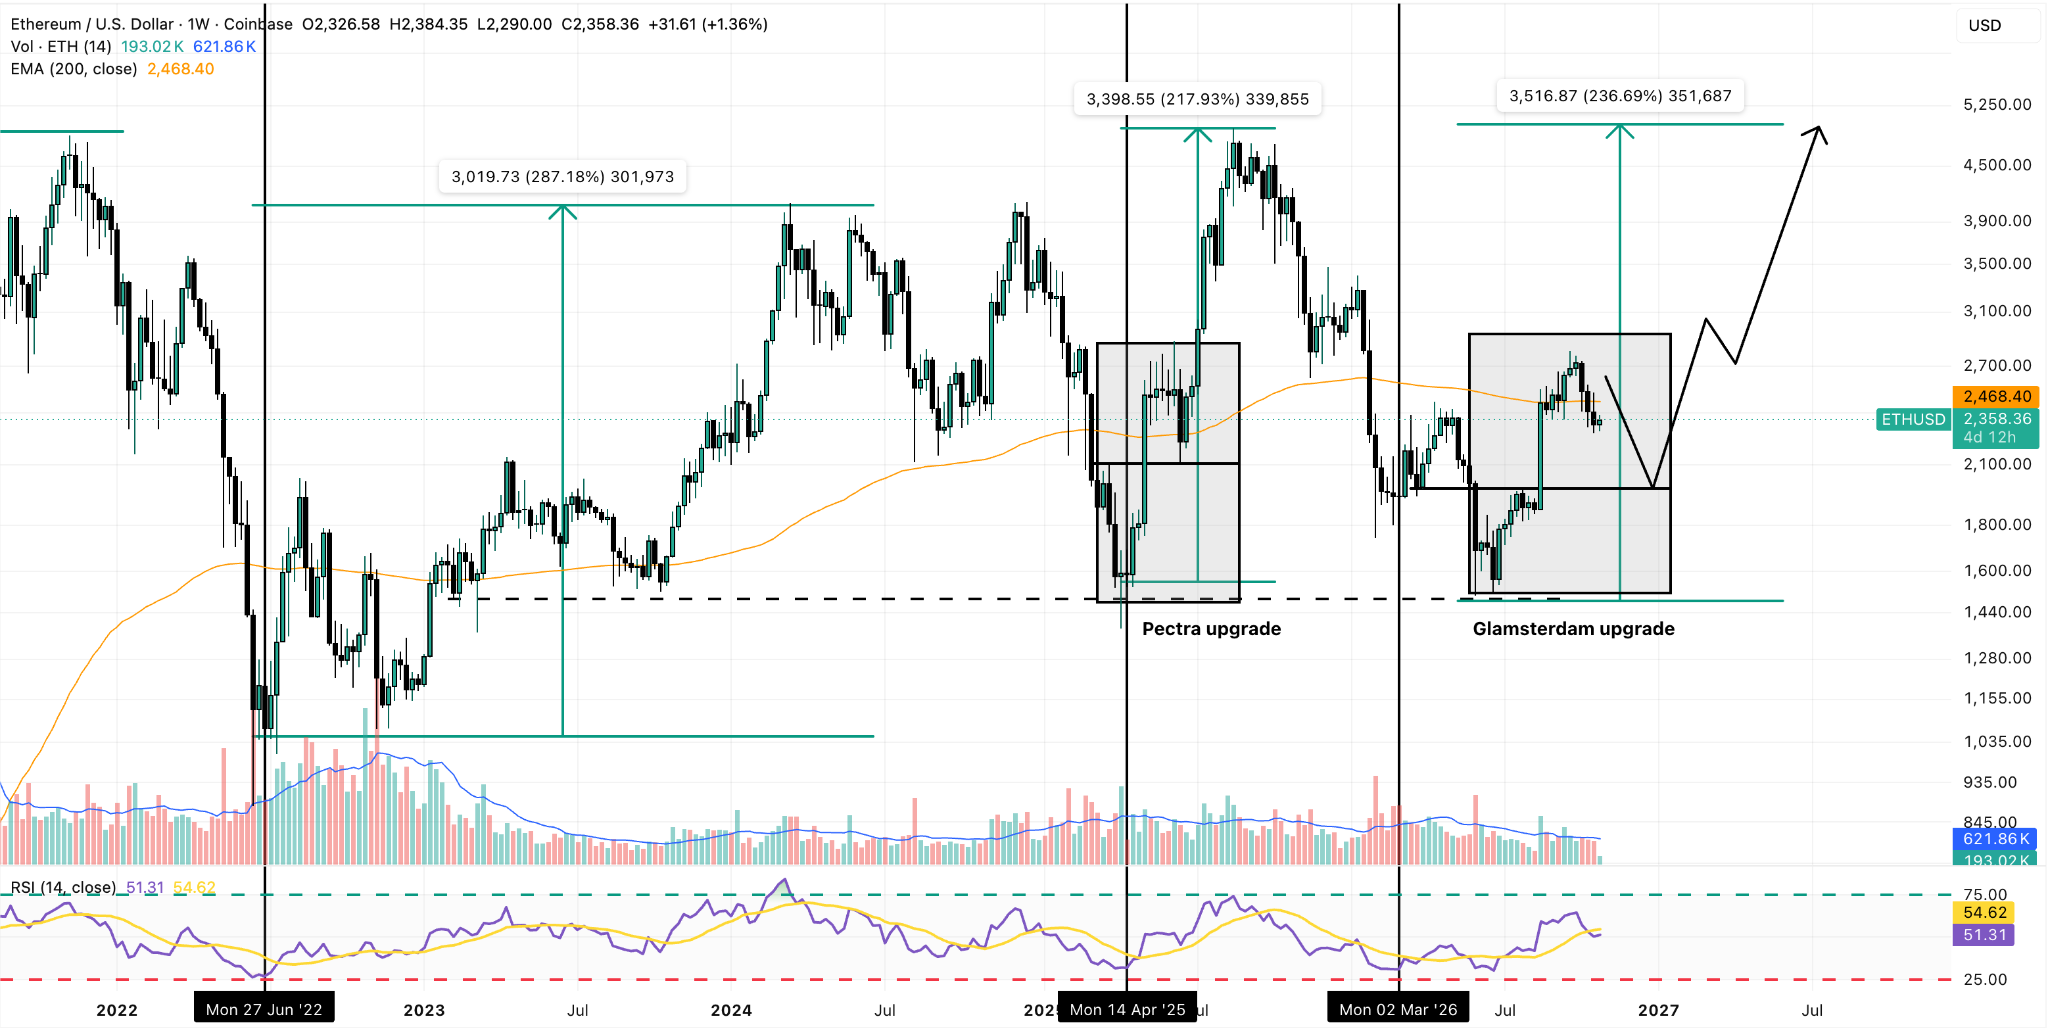
The price experienced a strong jump shortly after rising past the $2,000, creating a fair value gap (FVG) to which ETH later on retreated to find the necessary liquidity to resume its rally.
The relevant support to watch in this case would be $1,970, as this is the key structural level to which the market should retreat based on these historical patterns. A break above the $2,800 resistance would confirm the resumption of the uptrend, and we expect ETH to keep rallying toward $4,000 if that happens.
Today’s FOMC meeting could trigger the next big move, as options expire and trading volumes tend to skyrocket. The market could take this opportunity to accelerate this latest correction to unlock high demand zones and fuel the token’s recovery.
Ethereum Price Forecast
Every new Ethereum analysis as it publishes, today's technical signal and key levels, live price — on one page.
See all Ethereum forecastsETH’s 200-Day EMA Breakout Could Catalyze the Next Leg Down
Turning to the daily chart, we can see that ETH just hit its 200-day exponential moving average (EMA) and bounced off this mark, although volumes were below the average when this happened.
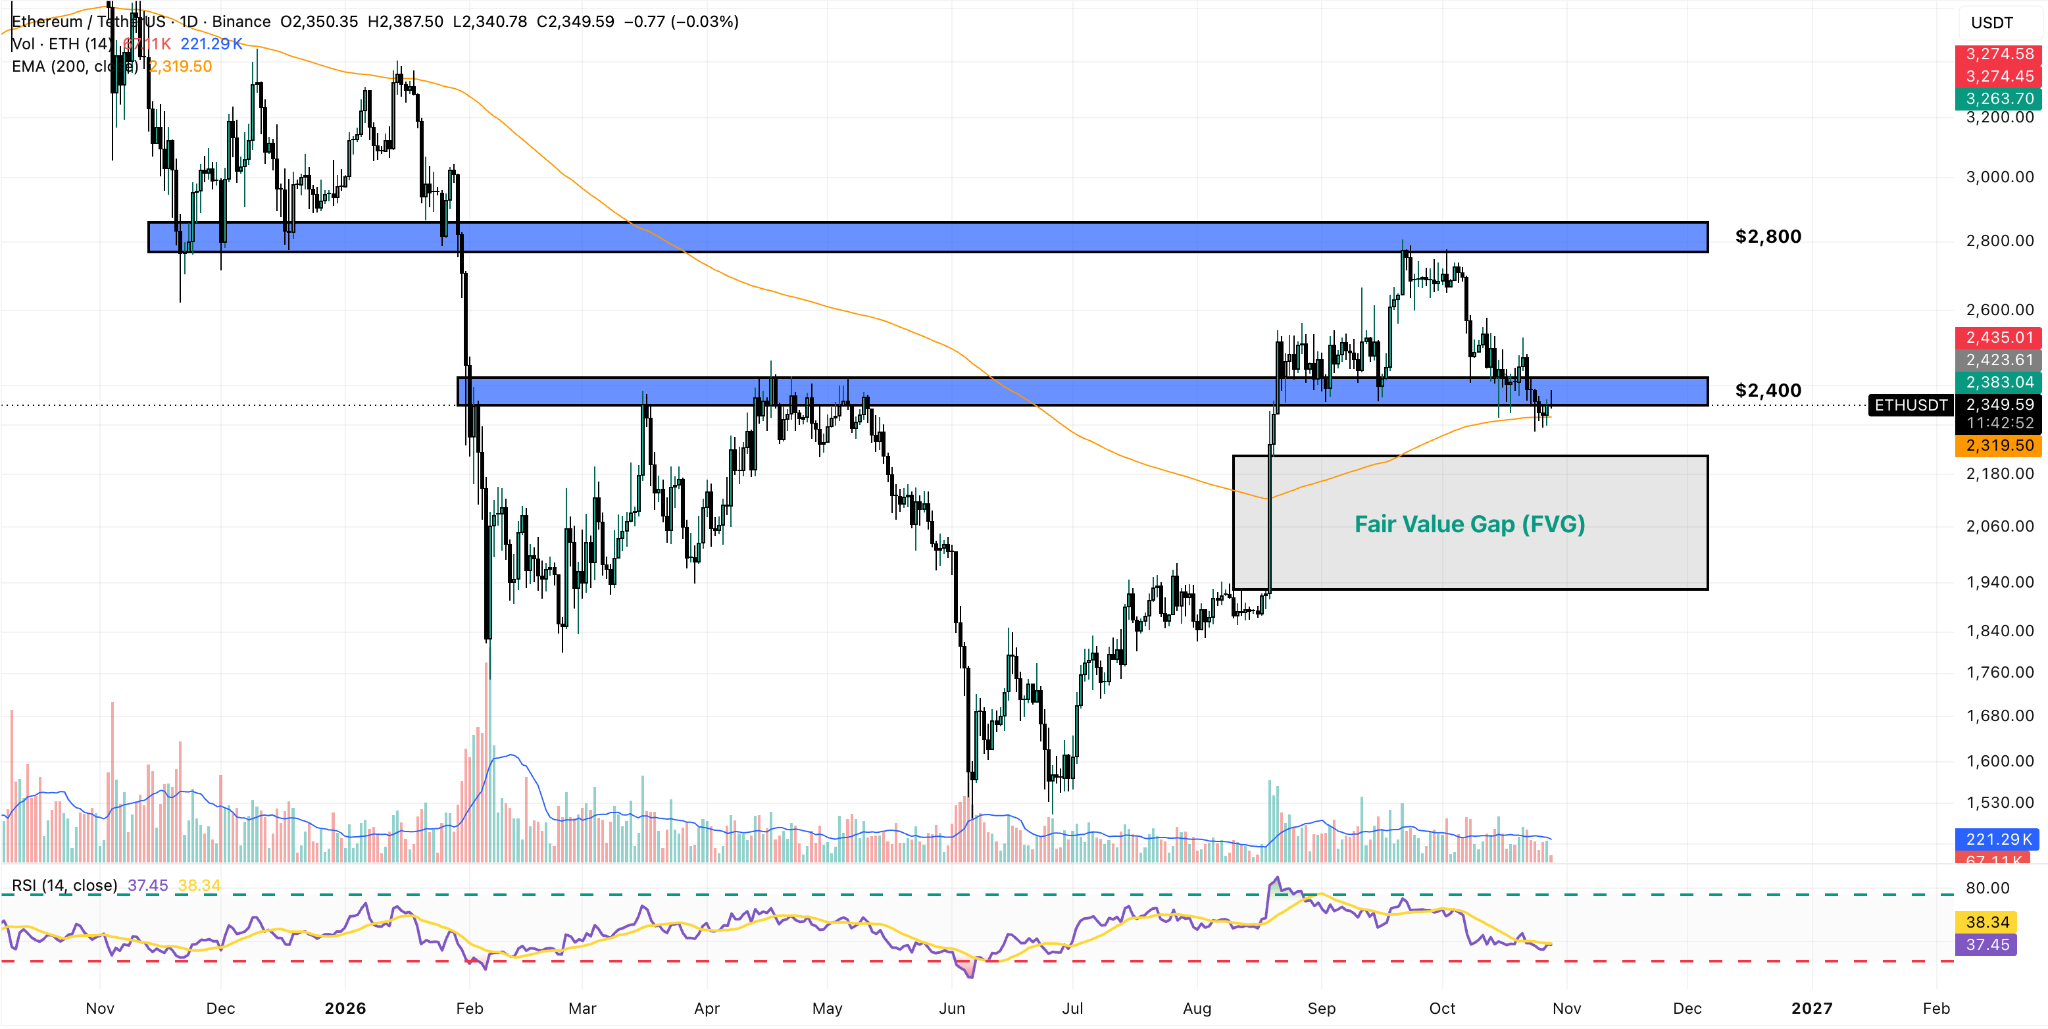
Bearish momentum has accelerated according to the Relative Strength Index (RSI), as the oscillator just dropped below 40 — typically interpreted as a sell signal.
However, the lower this metric goes, the more likely it is that the price action bounces back. The daily RSI may need to hit oversold levels before a technical bounce is due, which further increases the odds of a move to $1,970.
We would have to see a definite breakout below the 200-day EMA to confirm that ETH is moving toward this bearish target. This could be an attractive opportunity to short the top altcoin, especially if the Fed’s meeting ignites a big move.