


Ethereum (ETH) seems on track to retest its previous cycle lows in the next few weeks, as the latest downtrend pushed the token below a key support at $1,850.
Trading volumes for the top altcoin remain high, accounting for 5% of the asset’s circulating market cap at $11.8 billion.
Market sentiment has soured to the point that investors are now in “Extreme Fear” mode for the first time since June. Data from CoinMarketCap shows that the Crypto Fear and Greed Index currently sits at 13 — the lowest level that the metric has hit since February.
Ethereum ETFs See $2.4 Billion in Net Outflows in 7 Weeks
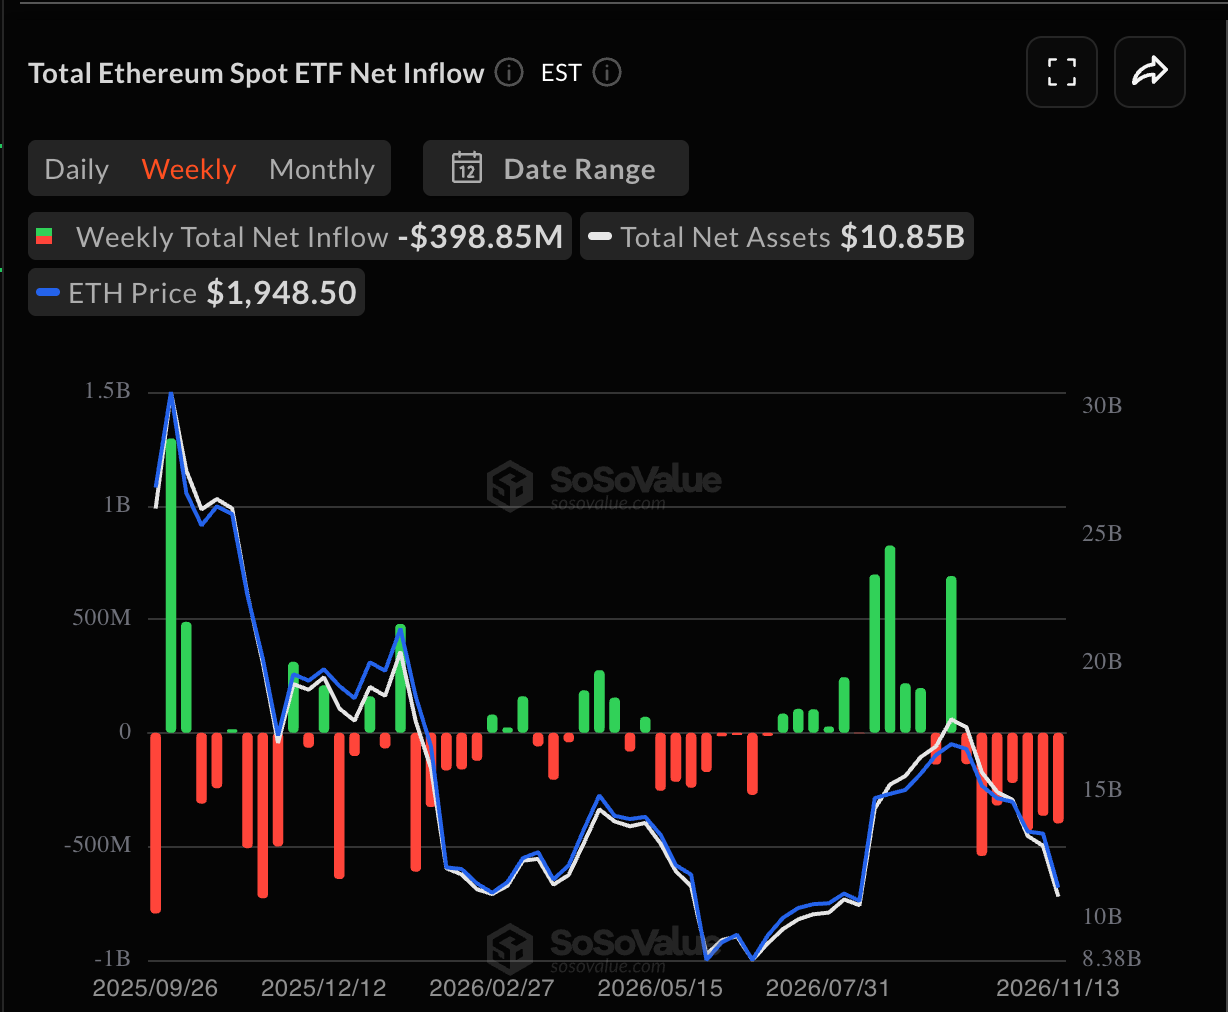
Data from SoSoValue indicates that Ethereum ETFs have seen net outflows for 7 weeks in a row now. In total, investors have withdrawn $2.4 billion during this period.
It has been quite a volatile year for cryptocurrencies, as geopolitical tensions, a deteriorating macro backdrop in the United States, and political setbacks have prevented the market from rallying further.
The Democrats’ latest victory during the mid-term elections may bring back to the table the hurdles that the industry thought it had cleared with President Donald Trump’s victory in November 2024.
No meaningful progress was made in drafting and passing a comprehensive piece of legislation that allowed blockchain technology and its associated trends (e.g., DeFi) to thrive in the country.
Hence, the market could now be aiming to correct course and push prices to levels not seen in years. Wall Street’s reaction to these latest developments has been quite negative, as reflected by how net inflows to exchange-traded funds (ETFs) have been behaving.
Meanwhile, on-chain data from Santiment shows that the MVRV Ratio has swung to negative territory once again.
This is a metric that tracks the value of all ETH tokens in circulation at the price at which they were bought compared to the token’s total market value. At -25%, it indicates that we are once again in bear market territory.
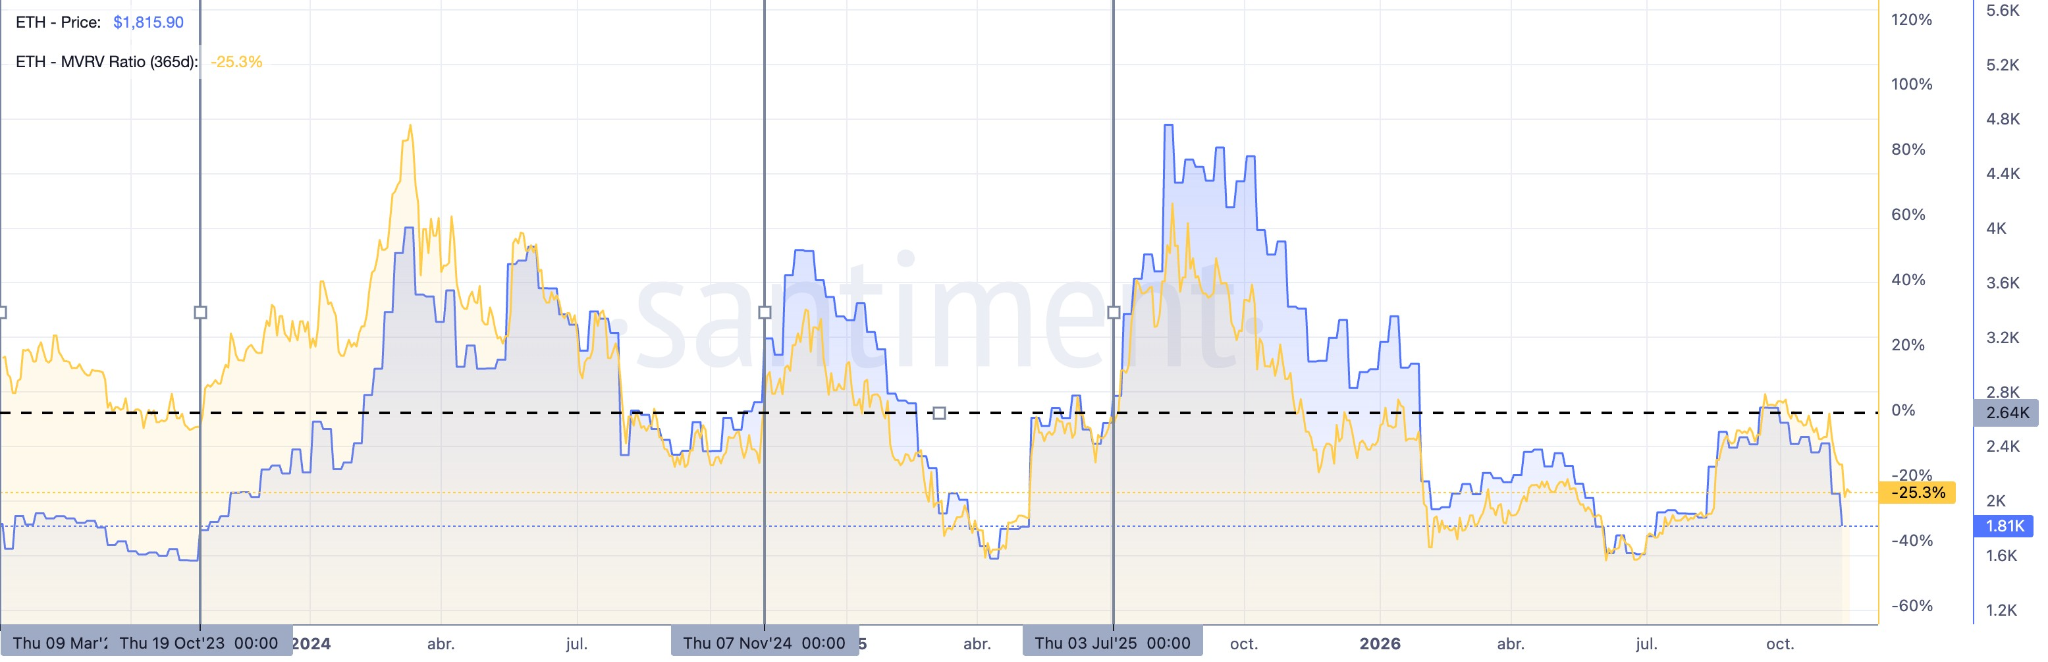
Most investors who bought during the August – September rally are now underwater, which contributes to increasing the odds of a capitulation if the price succumbs to much lower areas.
Ethereum Price Forecast
Every new Ethereum analysis as it publishes, today's technical signal and key levels, live price — on one page.
See all Ethereum forecastsETH May Retest its June Lows at $1,500 After a Technical Rebound
Turning to the daily chart, we can see that ETH broke below $1,850 and briefly retested that level from below, confirming its technical relevance.
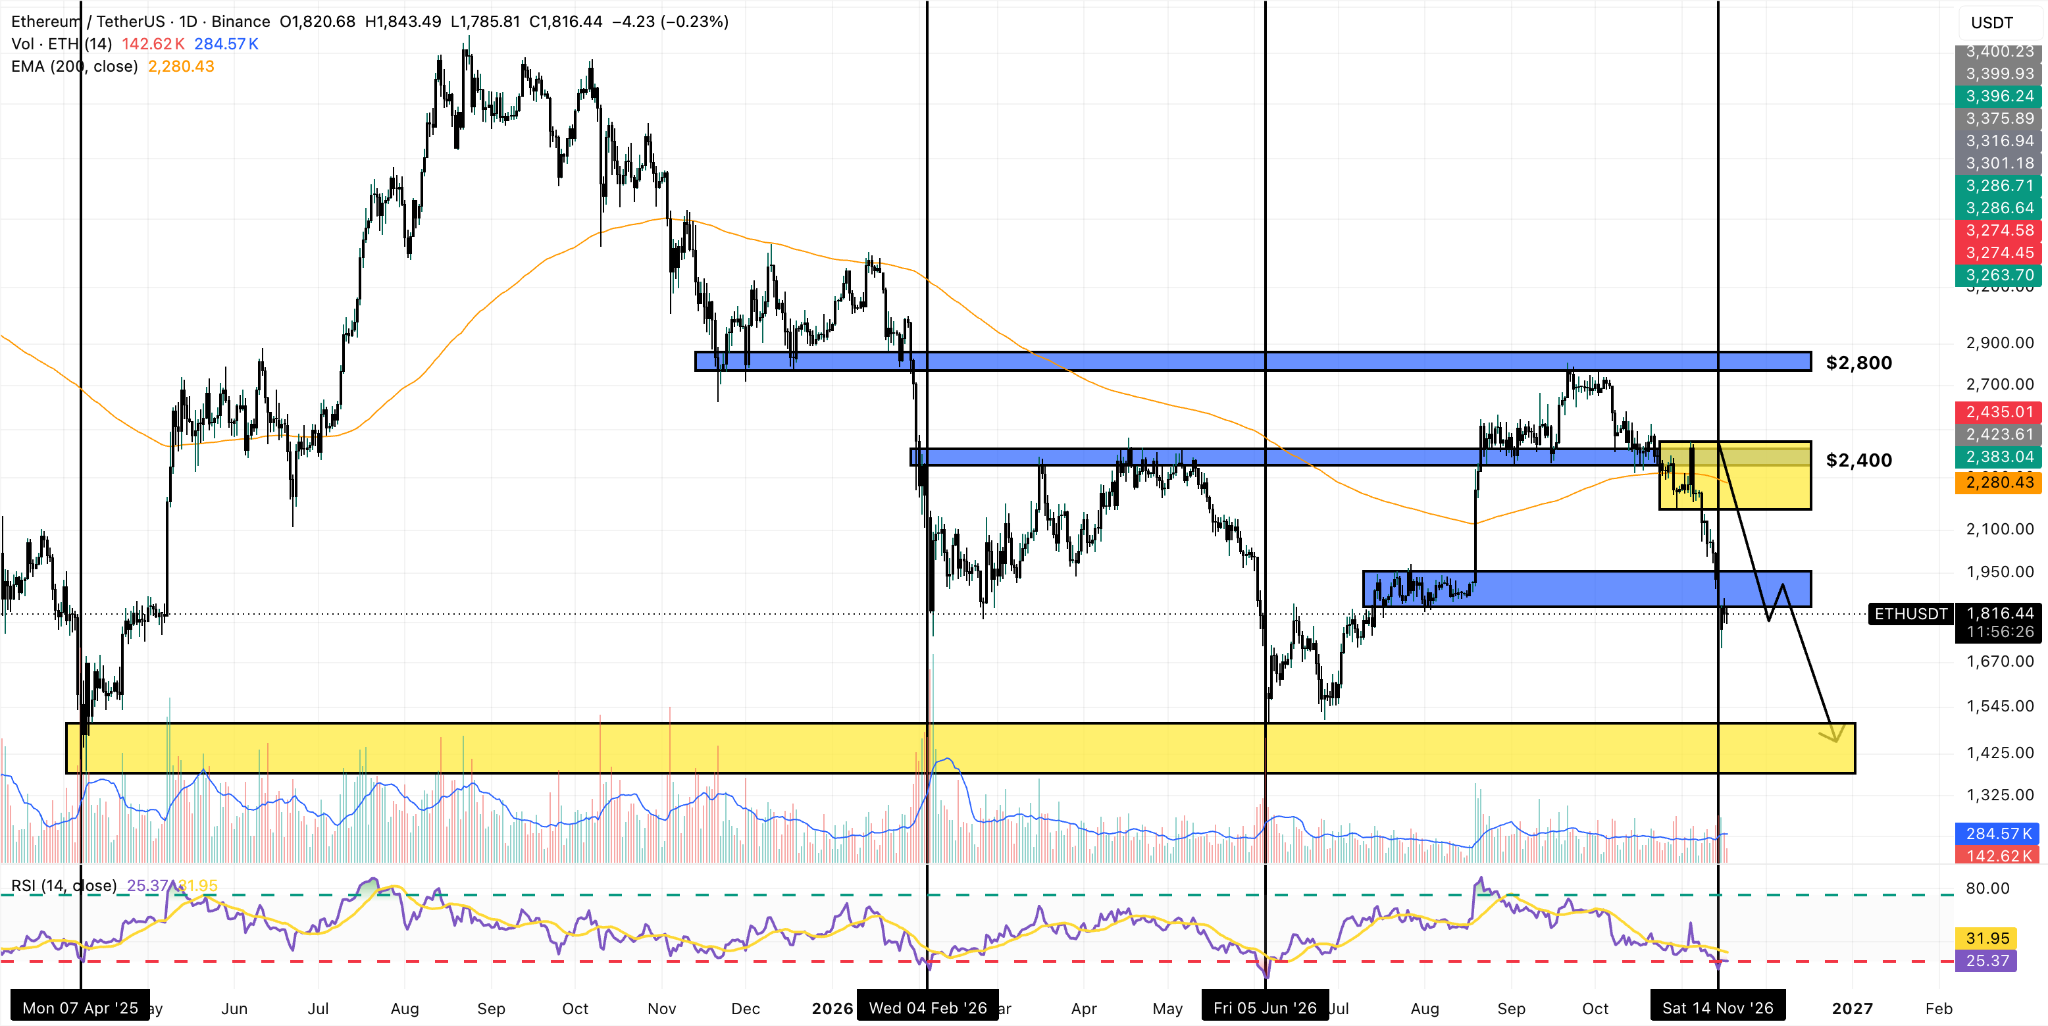
We now see the possibility that this retest could mark the beginning of the continuation of this downtrend toward the token’s June lows at around $1,500. If that’s the case, ETH could also be aiming to fully fill the order blocks that could still be sitting at $1,475, which was its cycle low during the 2025 bear market.
Negative momentum has reached extreme levels once again, as the Relative Strength Index (RSI) just hit 24, meaning that the top altcoin is heavily oversold.
In the three previous instances that the RSI has hit these low levels, the price has rebounded strongly, either to begin a bull market (2025 – 2026) or to retest previous areas of resistance.
If ETH recaptures the $1,900 area, we could see it rallying back to $2,400 based on these historical patterns in the RSI. However, if the downtrend continues, it is highly likely that we’ll see the altcoin retesting its June lows of 1,500, meaning an 18% downside risk based on today’s price.