



The GBP/USD exchange rate awaits domestic cues from the UK’s economic docket, although no significant releases are scheduled imminently. Earlier today, Rightmove HPI month-over-month increase at 1.5% suggests a firming housing market, which could lend some support to the Pound.
However, the broader narrative for both currency pairs will likely be influenced by the USD side of the equation, with the Federal Reserve’s announcements on the Federal Funds Rate and economic projections set to capture the market’s attention.
US Dollar Index (DXY)

In today’s technical outlook, we focus on the Dollar Index, which currently stands at 103.461, marking a slight increase of 0.01%. The key pivot point for today is set at $103.365, serving as a critical juncture for future price movements.
Notably, the immediate resistance is identified at $103.634, with subsequent barriers at $103.932 and $104.295, respectively. Conversely, support levels are positioned at $103.107, $102.733, and $102.355, outlining potential fallback zones.
The 50-Day Exponential Moving Average (EMA) lies at 103.215, slightly below the current price, while the 200-Day EMA is observed at 103.516, hinting at a closely contested trading environment.
The overarching trend appears bullish above the $103.365 mark, suggesting that surpassing this level could foster a positive trajectory.
EUR/USD Technical Forecast

The 50-Day Exponential Moving Average at 1.0901 marginally eclipses the current price, whereas the 200-Day EMA at 1.0862 underpins it. This setup suggests a cautiously bullish stance above $1.0874, yet a descent below this threshold may ignite a sharper selling momentum.
GBP/USD Technical Forecast
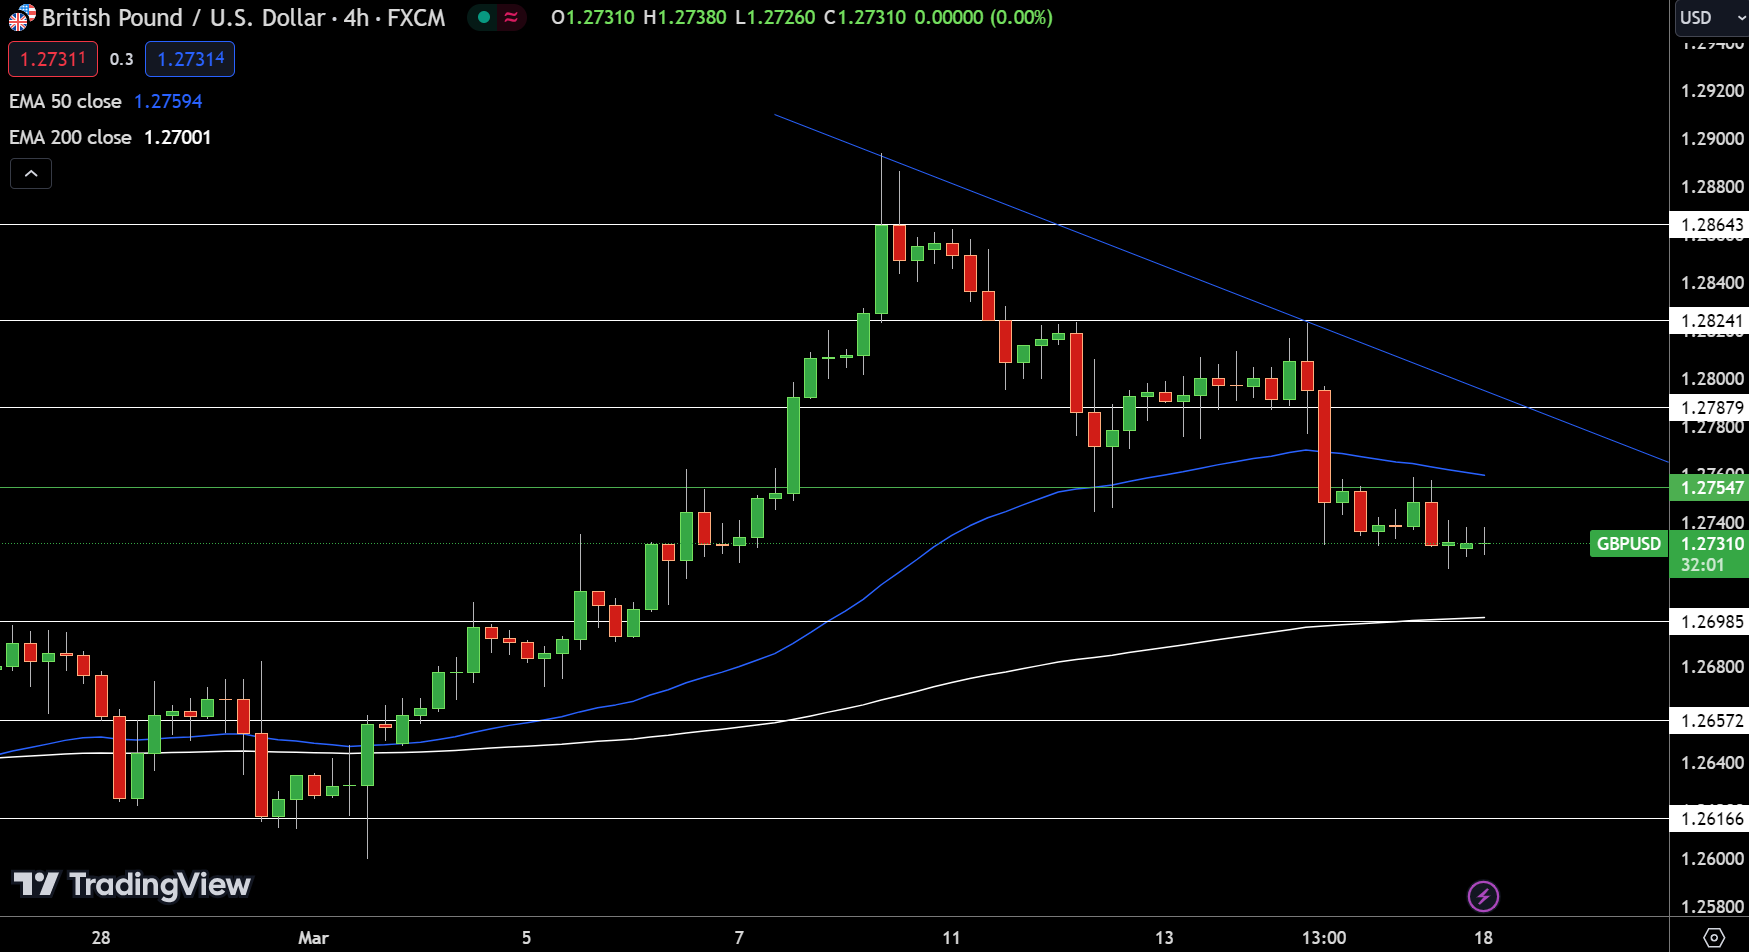
Today’s focus is on the GBP/USD pair, which slightly decreased by 0.01%, currently at 1.27310. The pivot point for the day is established at $1.2755, a critical level that investors should monitor closely. Resistance is observed at $1.2788, followed by $1.2824 and $1.2864, indicating potential upward movement thresholds.
On the downside, support levels are identified at $1.2699, $1.2657, and $1.2617, which could halt further declines. The 50-Day Exponential Moving Average (EMA) at 1.2759 suggests a near-equilibrium state with the current price, while the 200-Day EMA at 1.2700 provides a slight bullish undertone.
The overall trend is bearish below $1.2755, but a breakout above this level may introduce a stronger bullish sentiment. Conversely, maintaining below this pivot could confirm the bearish outlook.
For a look at all of today’s economic events, check out our economic calendar.